- Amidst weak volatility seen on MKR recently, on-chain analysis gives a clue to an impending breakthrough.
- Charts show that technical indicators also agree with the long-term bullish outlook for MKR.
Despite the stagnant outlook seen in Maker's price action (MKR), signals from technical and on-chain indicators have maintained that it is poised for an uptrend. It goes without saying that this tardiness in the cryptocurrency's reaction has stretched a little more than expected.
Maker DAO price prepares for a bullish impulse
According to on-chain metrics tracker, Dune analytics, a correlation between the price and the total value of tokens that have been locked seems to signal a bullish trend. Historical data show MKR to have made a considerable increase from $432 seen on January 1 to $512, where it currently sits, accounting for just an 18.5% increment.
TVL vs price per day
It could also be observed that the total value of tokens locked within this period has skyrocketed by over 1000%, from $210 million to $2.3 billion. The discrepancy between the price growth and these tokens, which have been put out of circulation, suggests a rally could be in sight as the growing scarcity of MKR is expected to lead to a new uptrend.
A tool from Santiment, another provider of on-chain market insights, shows that MKR's cost has a track record of responding to spikes in the number of daily active addresses. On August 13, a surge to $797 was accompanied by an eruption in holders' activities on the blockchain. Upon observation, this market behavior implies more room for an impending upswing.
Daily transaction vs price
Following MKR's rise above $790 on August 13, the governance token has returned most of its gains to the market. After a correction that saw it plummet by 44% over the next 47 days. Since then, there has been a slight return, which has seen the token trading between $490 and $590.
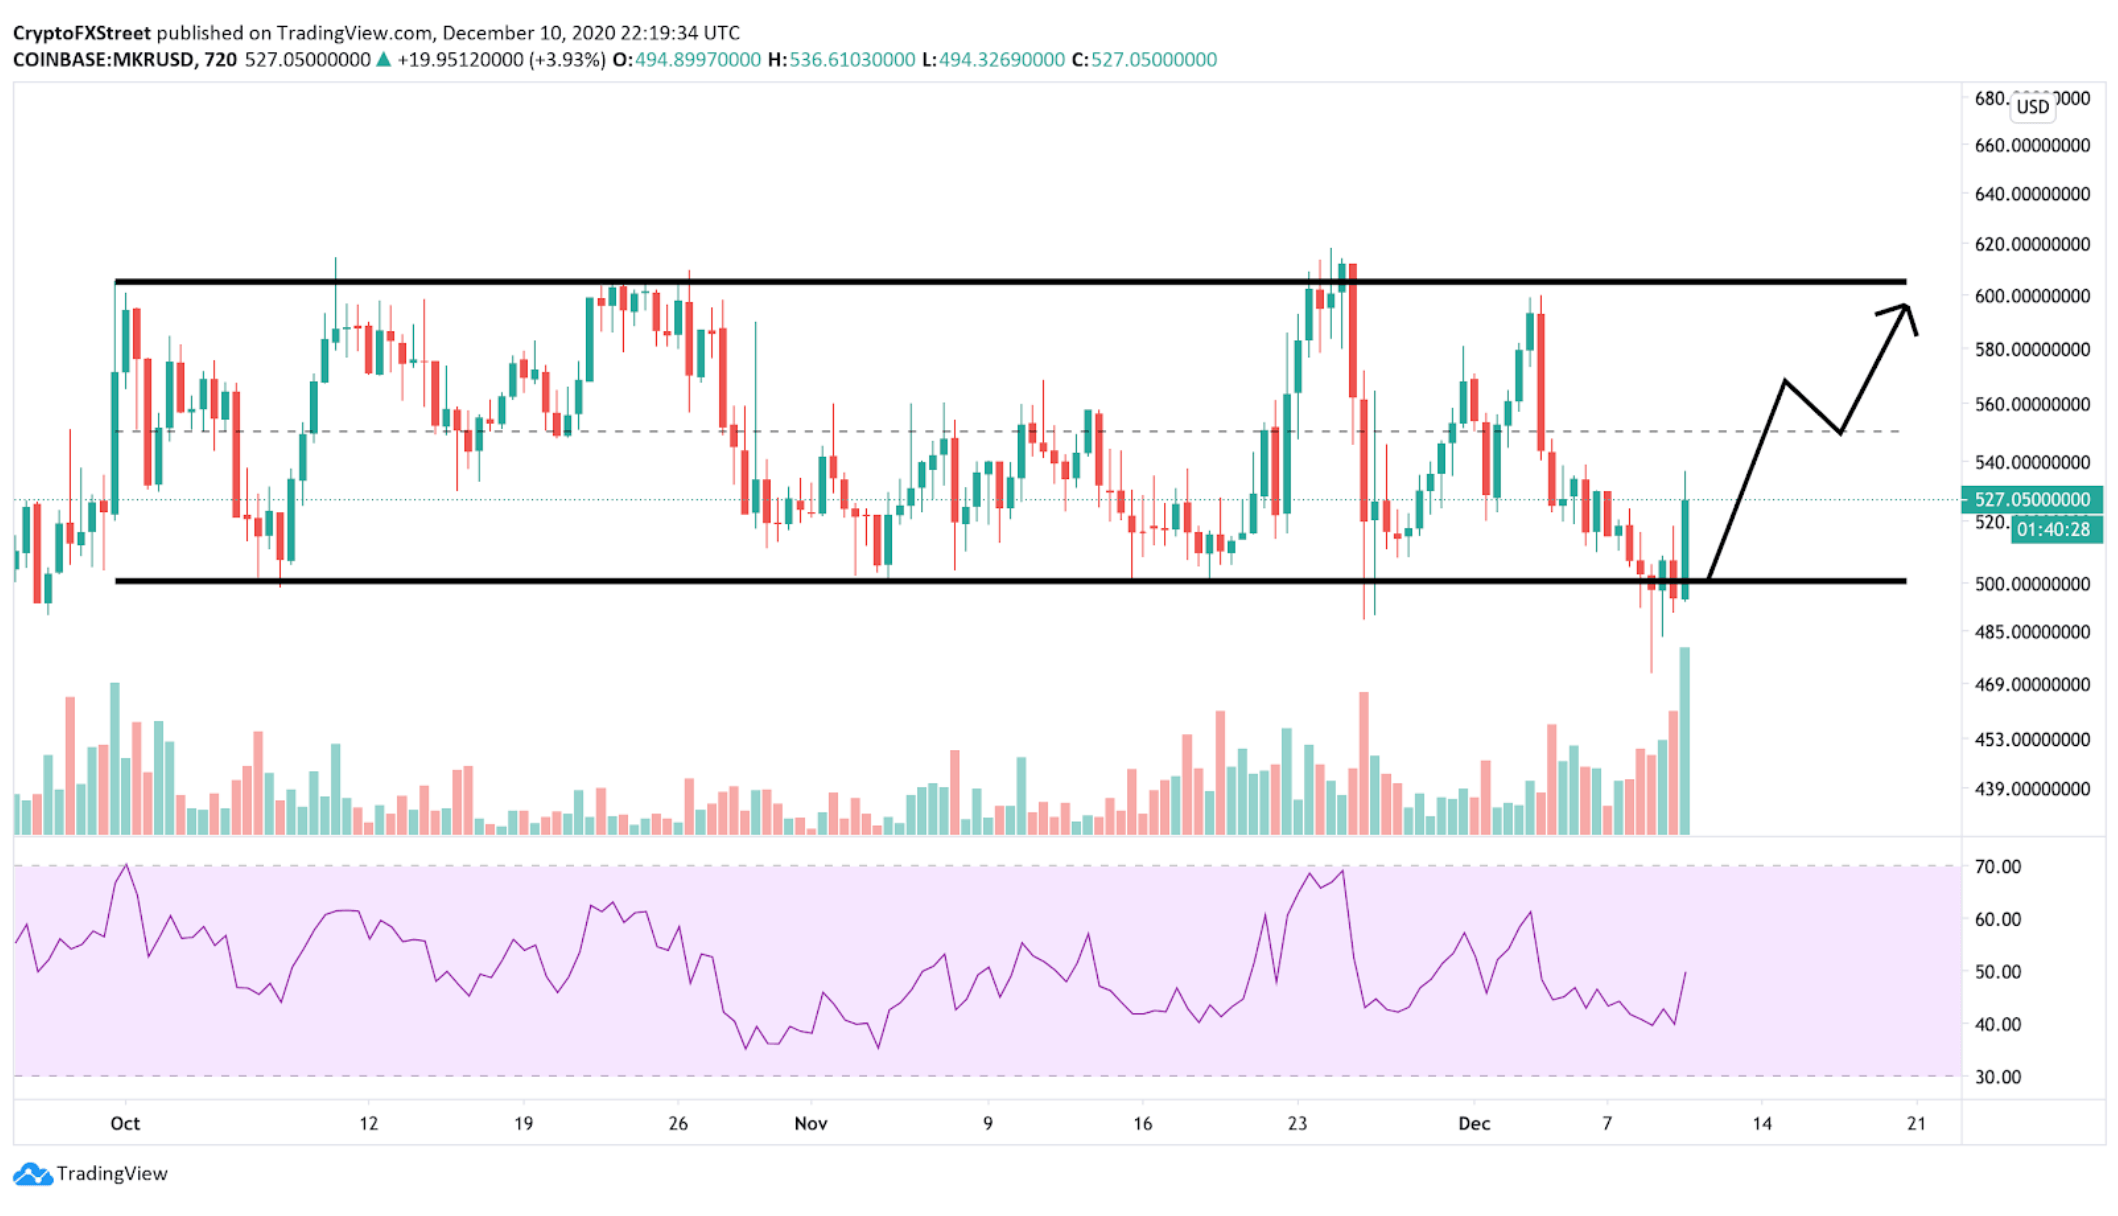
MKR/USD daily chart
The chart pattern seems to be enclosed within the parallel channel, meaning a potential rebound from the lower boundary to the upper edge. A slight upward inclination of the relative strength index (RSI) indicators confirms this bullishness as it currently rests within the midpoint.
Information on these pages contains forward-looking statements that involve risks and uncertainties. Markets and instruments profiled on this page are for informational purposes only and should not in any way come across as a recommendation to buy or sell in these assets. You should do your own thorough research before making any investment decisions. FXStreet does not in any way guarantee that this information is free from mistakes, errors, or material misstatements. It also does not guarantee that this information is of a timely nature. Investing in Open Markets involves a great deal of risk, including the loss of all or a portion of your investment, as well as emotional distress. All risks, losses and costs associated with investing, including total loss of principal, are your responsibility. The views and opinions expressed in this article are those of the authors and do not necessarily reflect the official policy or position of FXStreet nor its advertisers. The author will not be held responsible for information that is found at the end of links posted on this page.
If not otherwise explicitly mentioned in the body of the article, at the time of writing, the author has no position in any stock mentioned in this article and no business relationship with any company mentioned. The author has not received compensation for writing this article, other than from FXStreet.
FXStreet and the author do not provide personalized recommendations. The author makes no representations as to the accuracy, completeness, or suitability of this information. FXStreet and the author will not be liable for any errors, omissions or any losses, injuries or damages arising from this information and its display or use. Errors and omissions excepted.
The author and FXStreet are not registered investment advisors and nothing in this article is intended to be investment advice.
Recommended Content
Editors’ Picks
Ripple wipes out weekly gains, experts comment on role of Ripple stablecoin
Ripple declined to $0.52 on Thursday, erasing all gains registered earlier this week. Ripple SVP Eric van Miltenburg’s comments on the firm’s stablecoin, and how it is expected to benefit the XRP Ledger and native token XRP have raised concerns among crypto experts.
Hedera HBAR slips nearly 10% after air is cleared on mistaken link with giant BlackRock
HBAR price is down nearly 10% on Thursday, partly erasing gains inspired by the misinterpreted link with BlackRock. Despite the recent correction, Hedera’s price is up 44% in the past seven days.
The reason behind Bonk’s 105% rise and if you should buy now Premium
Bonk price has shot up 105% in the past five weeks. A retracement into $0.0000216 or the $0.0000152 to $0.0000186 imbalance would be a good buying opportunity. Patient investors can expect double-digit gains from BONK that could extend up to 70%.
Injective price weakness persists despite over 5.9 million INJ tokens burned
Injective price is trading with a bearish bias, stuck in the lower section of the market range. The bearish outlook abounds despite the network's deflationary efforts to pump the price. Coupled with broader market gloom, INJ token’s doomed days may not be over yet.
Bitcoin: BTC post-halving rally could be partially priced in Premium
Bitcoin (BTC) price briefly slipped below the $60,000 level for the last three days, attracting buyers in this area as the fourth BTC halving is due in a few hours. Is the halving priced in for Bitcoin? Or will the pioneer crypto note more gains in the coming days?