|

LTC/USD technical analysis shows bullish signals

  • LTC/USD price fell slightly from $45.80 to $45 this Tuesday.
  • Technical analysis shows several bullish indicators which may hint at an upcoming breakout.

LTC/USD daily chart

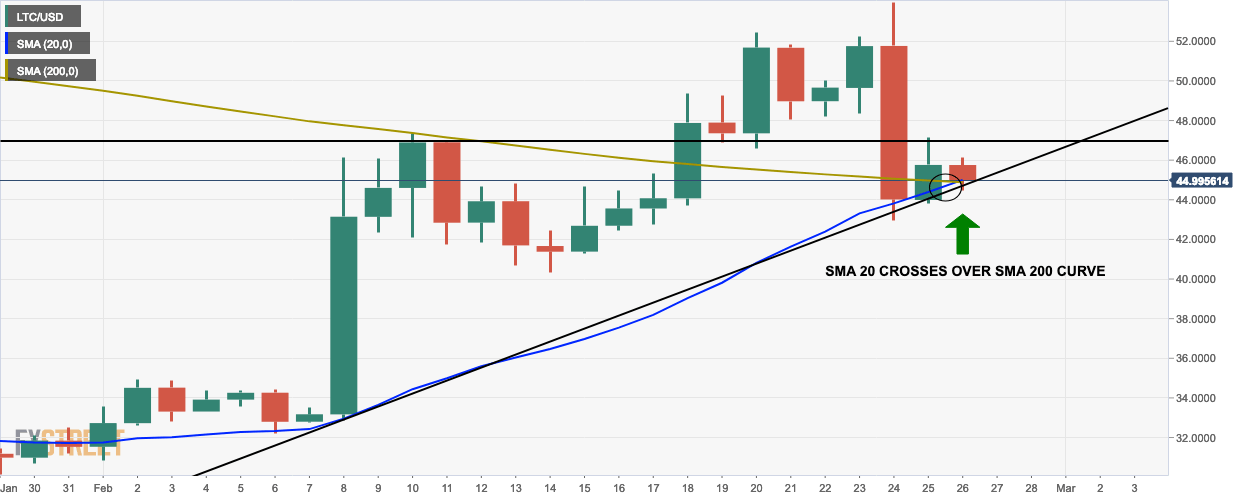
  • LTC/USD price went down from $45.80 to $45 and it is trending below both the 20-day simple moving average (SMA 20) curve and the SMA 200 curve.
  • The SMA 20 curve has crossed over the SMA 200 curve which indicates a buy signal.

LTC/USD 4-hour chart

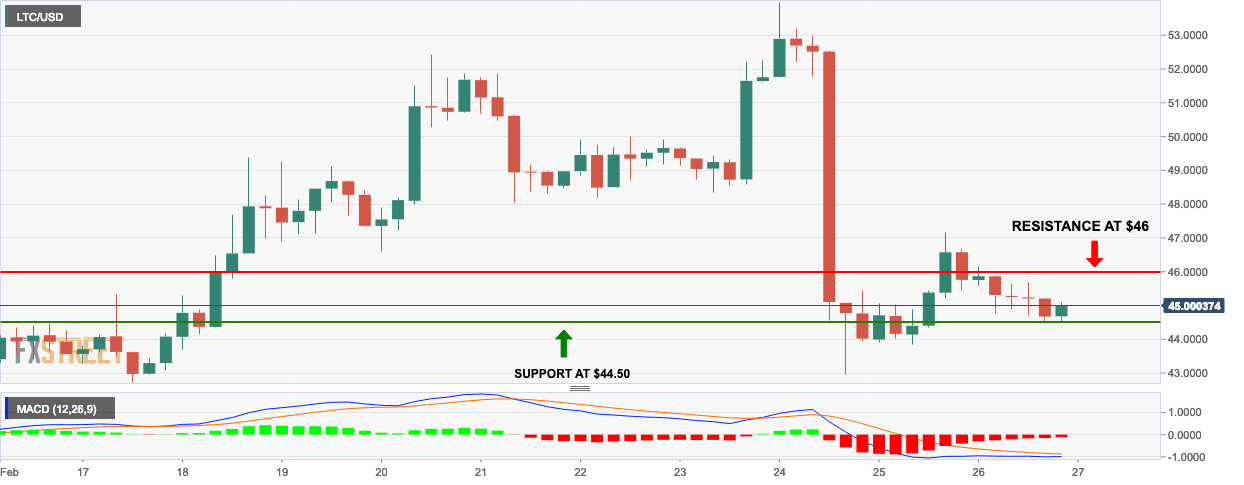
  • The LTC/USD 4-hour chart has found support at $44.50.
  • The moving average convergence/divergence (MACD) histogram shows that the bearish momentum is decreasing.

LTC/USD hourly

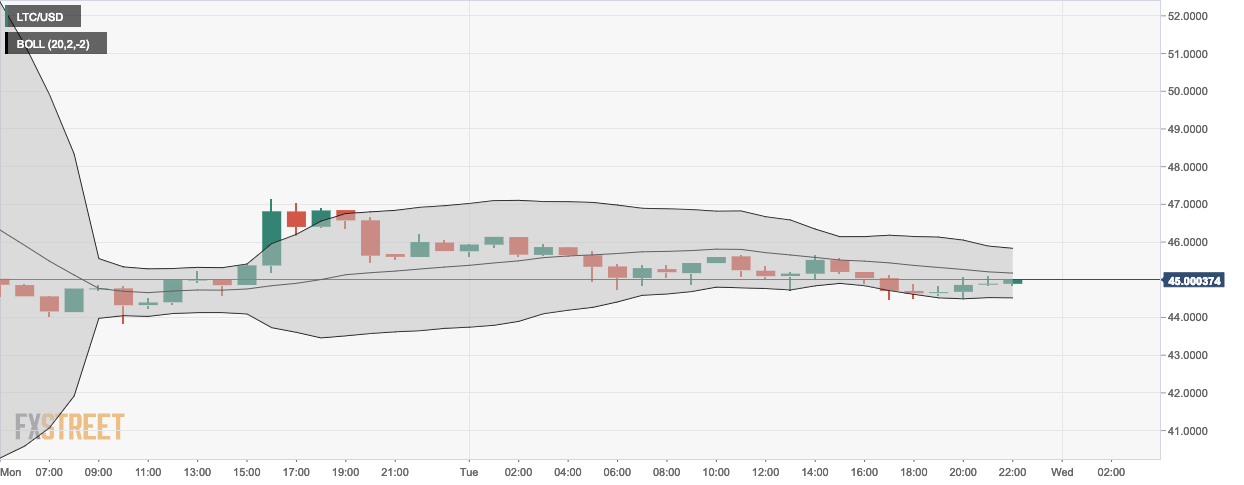
  • The LTC/USD hourly chart shows decreasing volatility in price according to the 20-day Bollinger band.
  • The last two sessions show that the price is creeping towards the 20-day simple moving average (SMA 20) curve.

Key Levels

  • Resistance 3: $50.6432
  • Resistance 2: $48.8978
  • Resistance 1: $47.3288
  • Pivot Point: $45.5833
  • Support 1: $44.0143
  • Support 2: $42.2688
  • Support 3: $40.6998

Author

Rajarshi Mitra

Rajarshi Mitra

Independent Analyst

Rajarshi entered the blockchain space in 2016. He is a blockchain researcher who has worked for Blockgeeks and has done research work for several ICOs. He gets regularly invited to give talks on the blockchain technology and cryptocurrencies.

More from Rajarshi Mitra
Share:

Editor's Picks

Ripple Price Forecast: XRP potential bottom could be in sight

Ripple edges up above the intraday low of $1.35 at the time of writing on Friday amid mixed price actions across the crypto market. The remittance token failed to hold support at $1.40 the previous day, reflecting risk-off sentiment amid a decline in retail and institutional sentiment. 

Crypto Today: Bitcoin, Ethereum, XRP in choppy price action, weighed down by falling institutional interest 

Bitcoin holds above support at $65,118 at the time of writing on Friday. Ethereum remains choppy in a narrow range between support at $1,900 and resistance at $2,000, while Ripple attempts another upward move toward the pivotal $1.40 level.

PancakeSwap Price Analysis: Bearish momentum suggests further downside

PancakeSwap (CAKE) is trading below $1.26 at the time of writing on Friday, extending the losses by over 8% so far this week. The weakening derivatives market further supports the bearish outlook, with bears aiming for levels below $1.18.

Decred Price Forecast: DCR rebounds toward key resistance zone on volume spike

Decred (DCR) rebounds over 7% at press time on Friday after a three-day decline of almost 14%. Roughly 60% increase in trading volume over the last 24 hours supports the recovery, suggesting heightened spot-market demand. 

Bitcoin Price Annual Forecast: BTC holds long-term bullish structure heading into 2026

Bitcoin (BTC) is wrapping up 2025 as one of its most eventful years, defined by unprecedented institutional participation, major regulatory developments, and extreme price volatility.

Bitcoin: BTC bears aren’t done yet

Bitcoin (BTC) price slips below $67,000 at the time of writing on Friday, remaining under pressure and extending losses of nearly 5% so far this week.