LTC/USD technical analysis: Litecoin bears negate the gains made by bulls over the last two days
- LTC/USD went down from $77.85 to $73 so far this Thursday.
- Litecoin drops back into the 20-day Bollinger Band following bearish correction.

LTC/USD bears have taken full control of the market. In the process, they have negated all the progress made by the bulls in the last two days. In the process, the price has gone down from $77.85 to $73 this Thursday. The hourly breakdown of LTC/USD shows us that the price went up to $80-region this Wednesday before it plummeted to $73.
LTC/USD daily chart
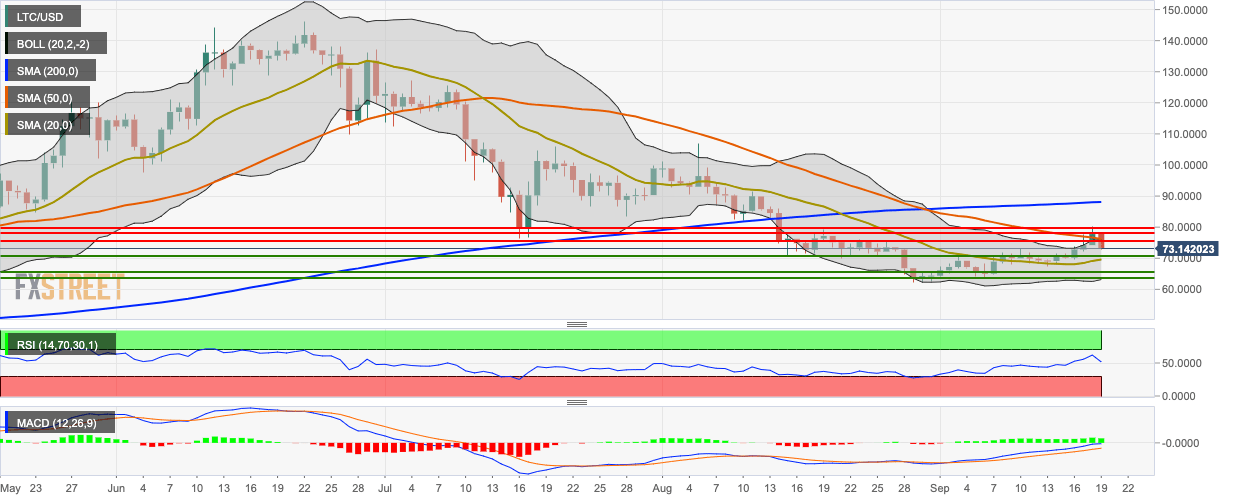
The price of LTC/USD has dropped back into the 20-day Bollinger Band following bearish correction. The price crept below the 50-day Simple Moving Average (SMA 50) curve, while it’s still above the SMA 20 curve. The Moving Average Convergence/Divergence (MACD) indicator shows increasing bullish momentum. The Relative Strength Index (RSI) indicator has dropped from 63.50 to 50.80.
Author

Rajarshi Mitra
Independent Analyst
Rajarshi entered the blockchain space in 2016. He is a blockchain researcher who has worked for Blockgeeks and has done research work for several ICOs. He gets regularly invited to give talks on the blockchain technology and cryptocurrencies.


