Long-term technical suggest that VeChain price is on its way to $0.90

The following article contains price and date projection analysis utilizing the methods of W.D. Gann and other traditional forecasting methods. VeChain is the first of several articles highlighting this style and approach of technical analysis. The purpose is not to target a specific date nor a specific price. Instead, the goal is to identify a range of time in the future, which is highly likely to be a turning point for any trend or corrective move. Additionally, the second purpose is to identify a price range and value area in that same time period.
Confluence zones
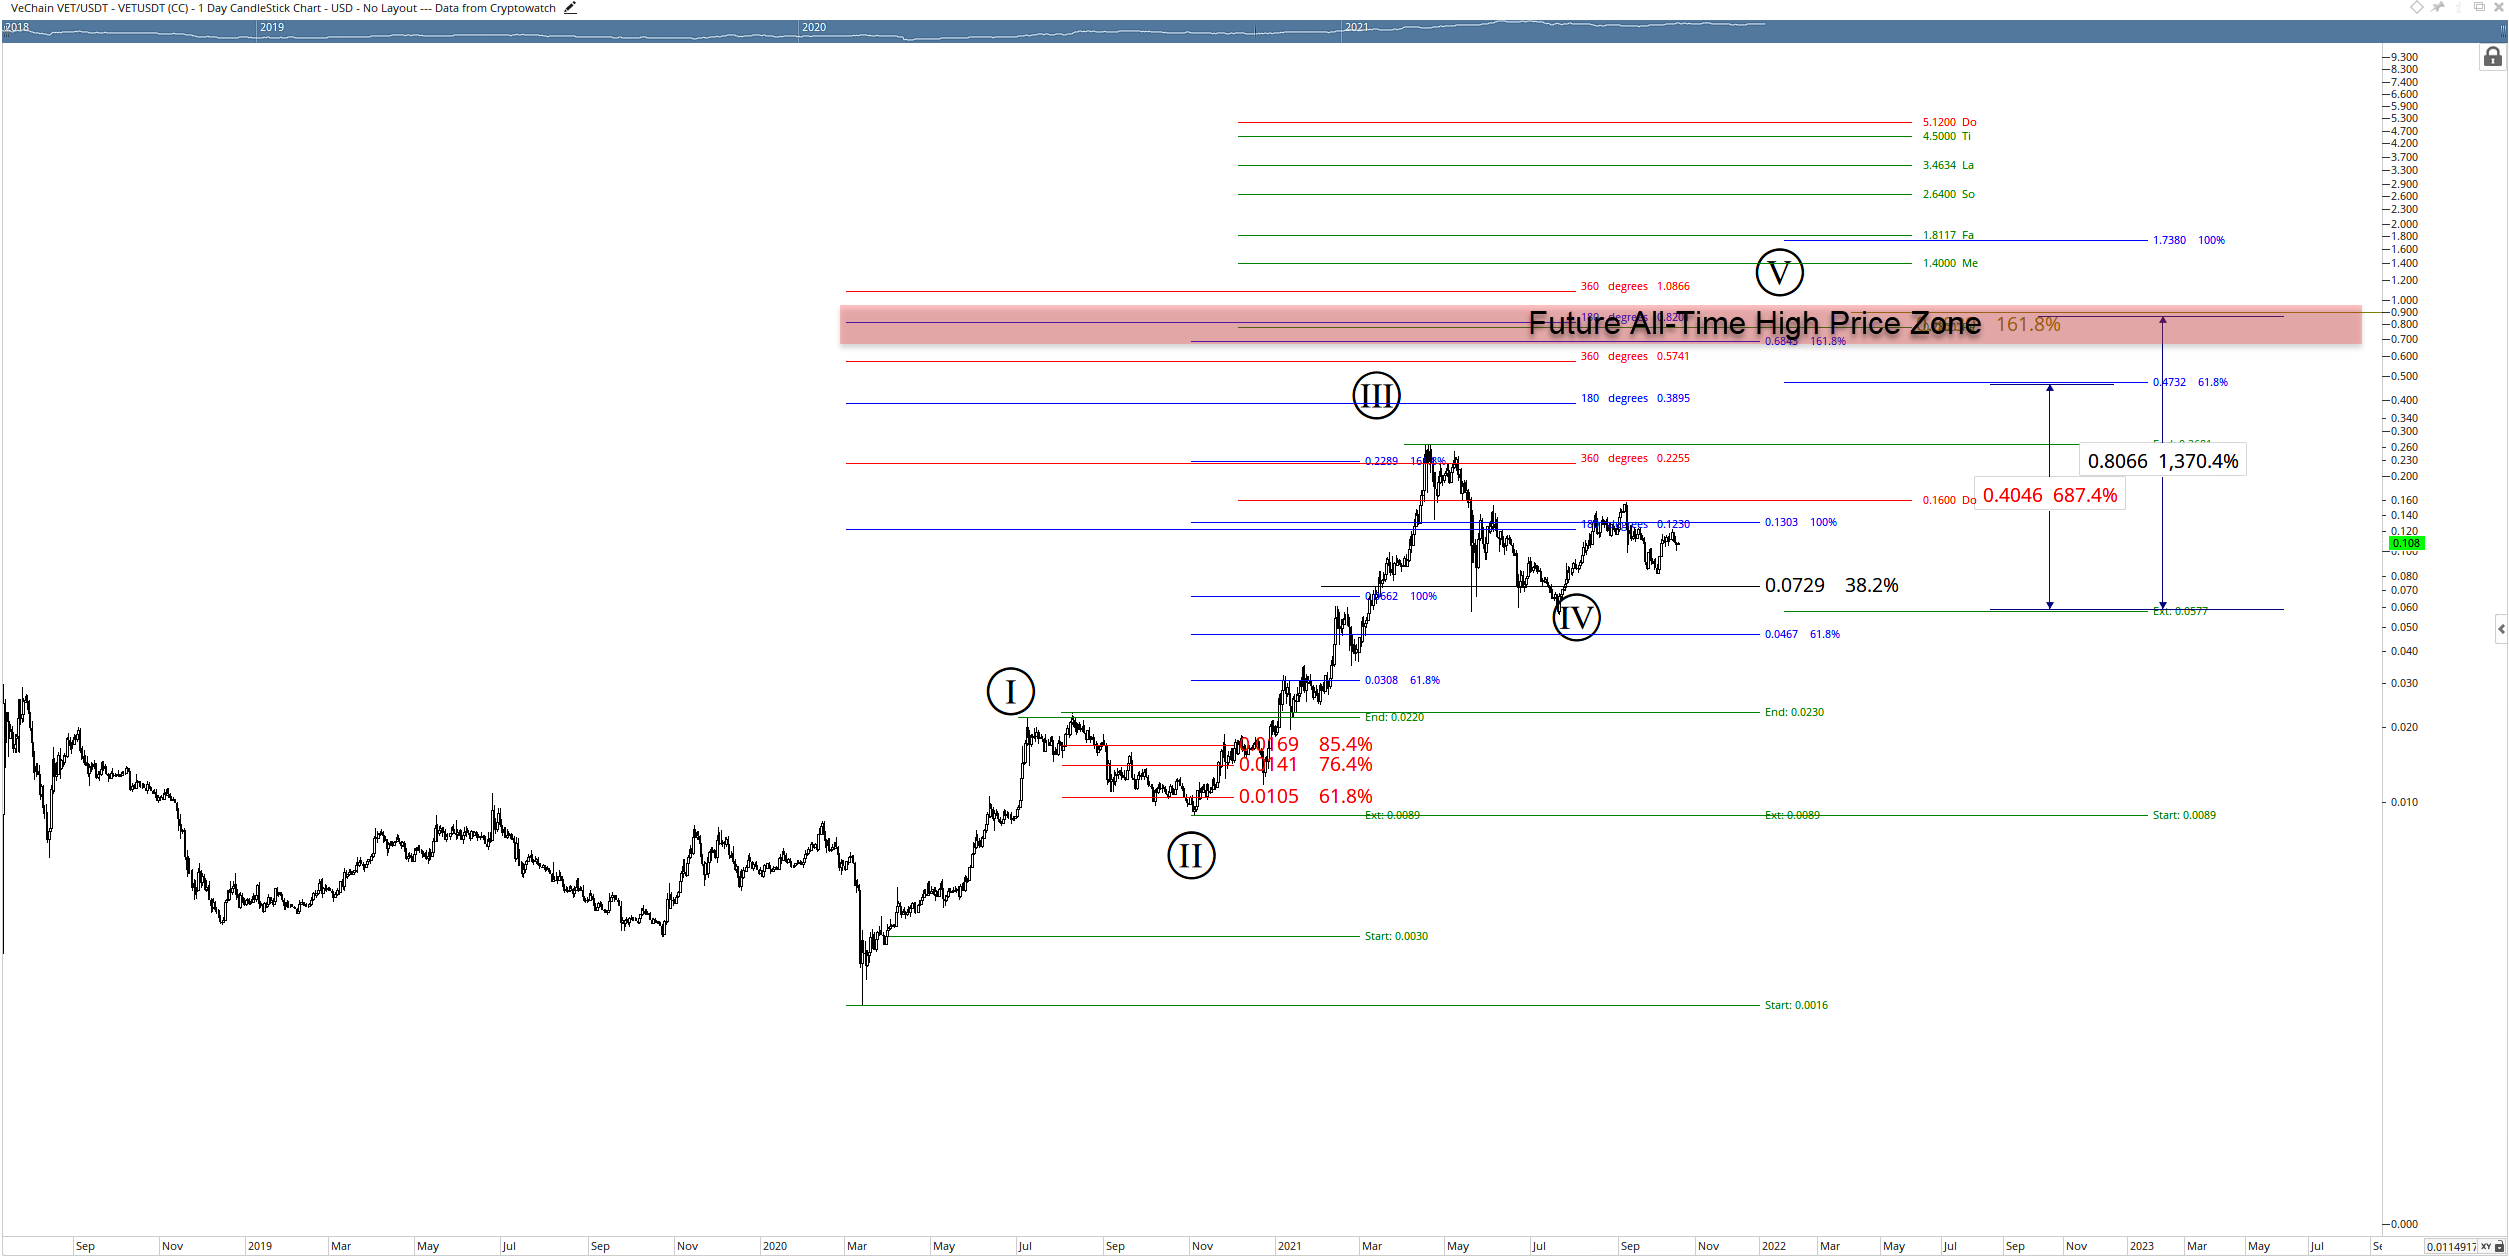
VET/USDT Price Clusters
How are future VeChain price levels determined if they have never traded at those price levels before? A series of different types of analysis should be completed to speculate and project a future price range. For this analysis, I will be utilizing Elliot Wave Theory, natural harmonic values found in the light and sound spectrum – specifically the methods by the great Gann analyst, Tony Plummer (The Law of Vibration, and The Life Cycle Hypothesis), Gann's Square of 9 and Fibonacci Expansion zones. The result of this analysis shows a cluster of price ranges, all with the same value area. They are as follows:
0.6843 - 161.8 of I and II Fib Expansion
0.866 - 61.8% of Wave 1 + 3
0.8930 - 161.8% inverse Fib retracement of Wave 4
0.78 - Major Octave of 'Re' (harmonic ranges in music)
$0.8201 - 180-degree Square of 9 angle
$0.081 - Top of a squared range in Gann's Square of a Range
Time Cycles
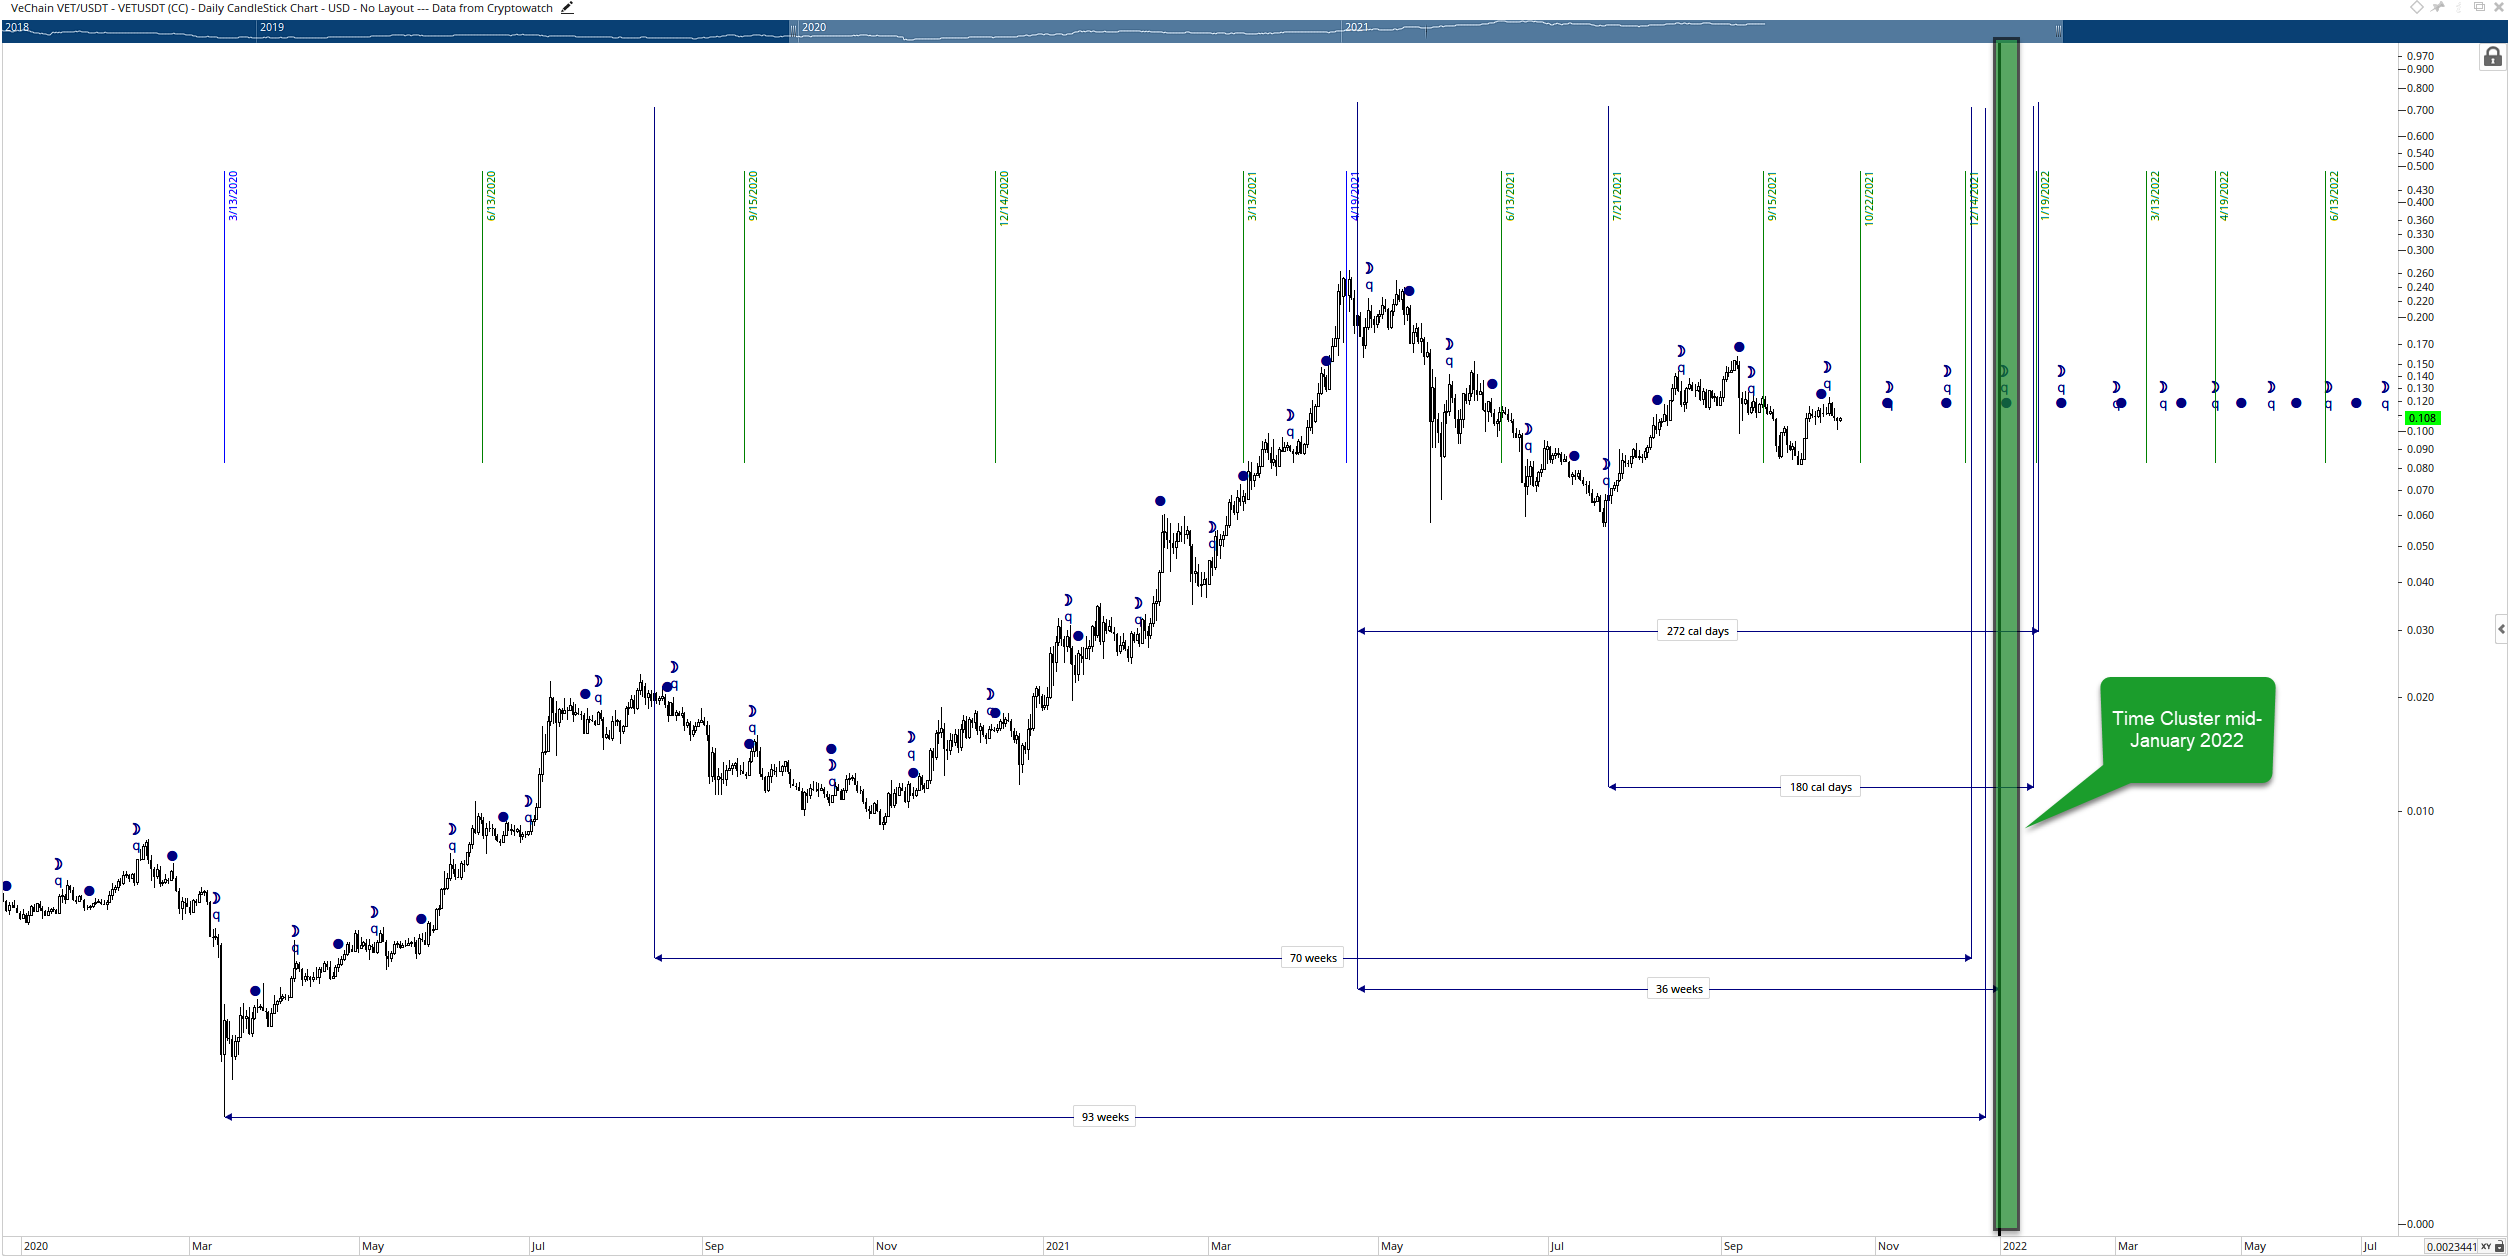
VET/USDT Time Clusters
In addition to projecting price levels in the future, we can do the same with time. For time cycle analysis, most of the analysis comes from Gann's work in major and minor time cycles and his use of astronomical cycles. The time studies are further supplemented with the Ichimoku Kinko Hyo system's Time Principle and Hurst Cycle Analysis. After completing this analysis, a massive cluster of cycles complete and coalesce in mid to late January 2022. Specifically, VeChain is projected to be at or near a new all-time high between January 14th and January 19th, 2022. The time analysis methods used are listed below:
Gann's Square of 9 dates.
Gann's Cycle of the Inner year day counts.
Gann's Master Square of 12 weekly counts.
Gann's Master Square of 12 monthly counts.
Ichimoku Monthly Kumo Twist
Lunar Phase (New and Full Moons)
Lunar Apogee and Perigee
Hurst Cycles
Gann's Minor Cycles (specifically the three-year cycle)
Putting it all together
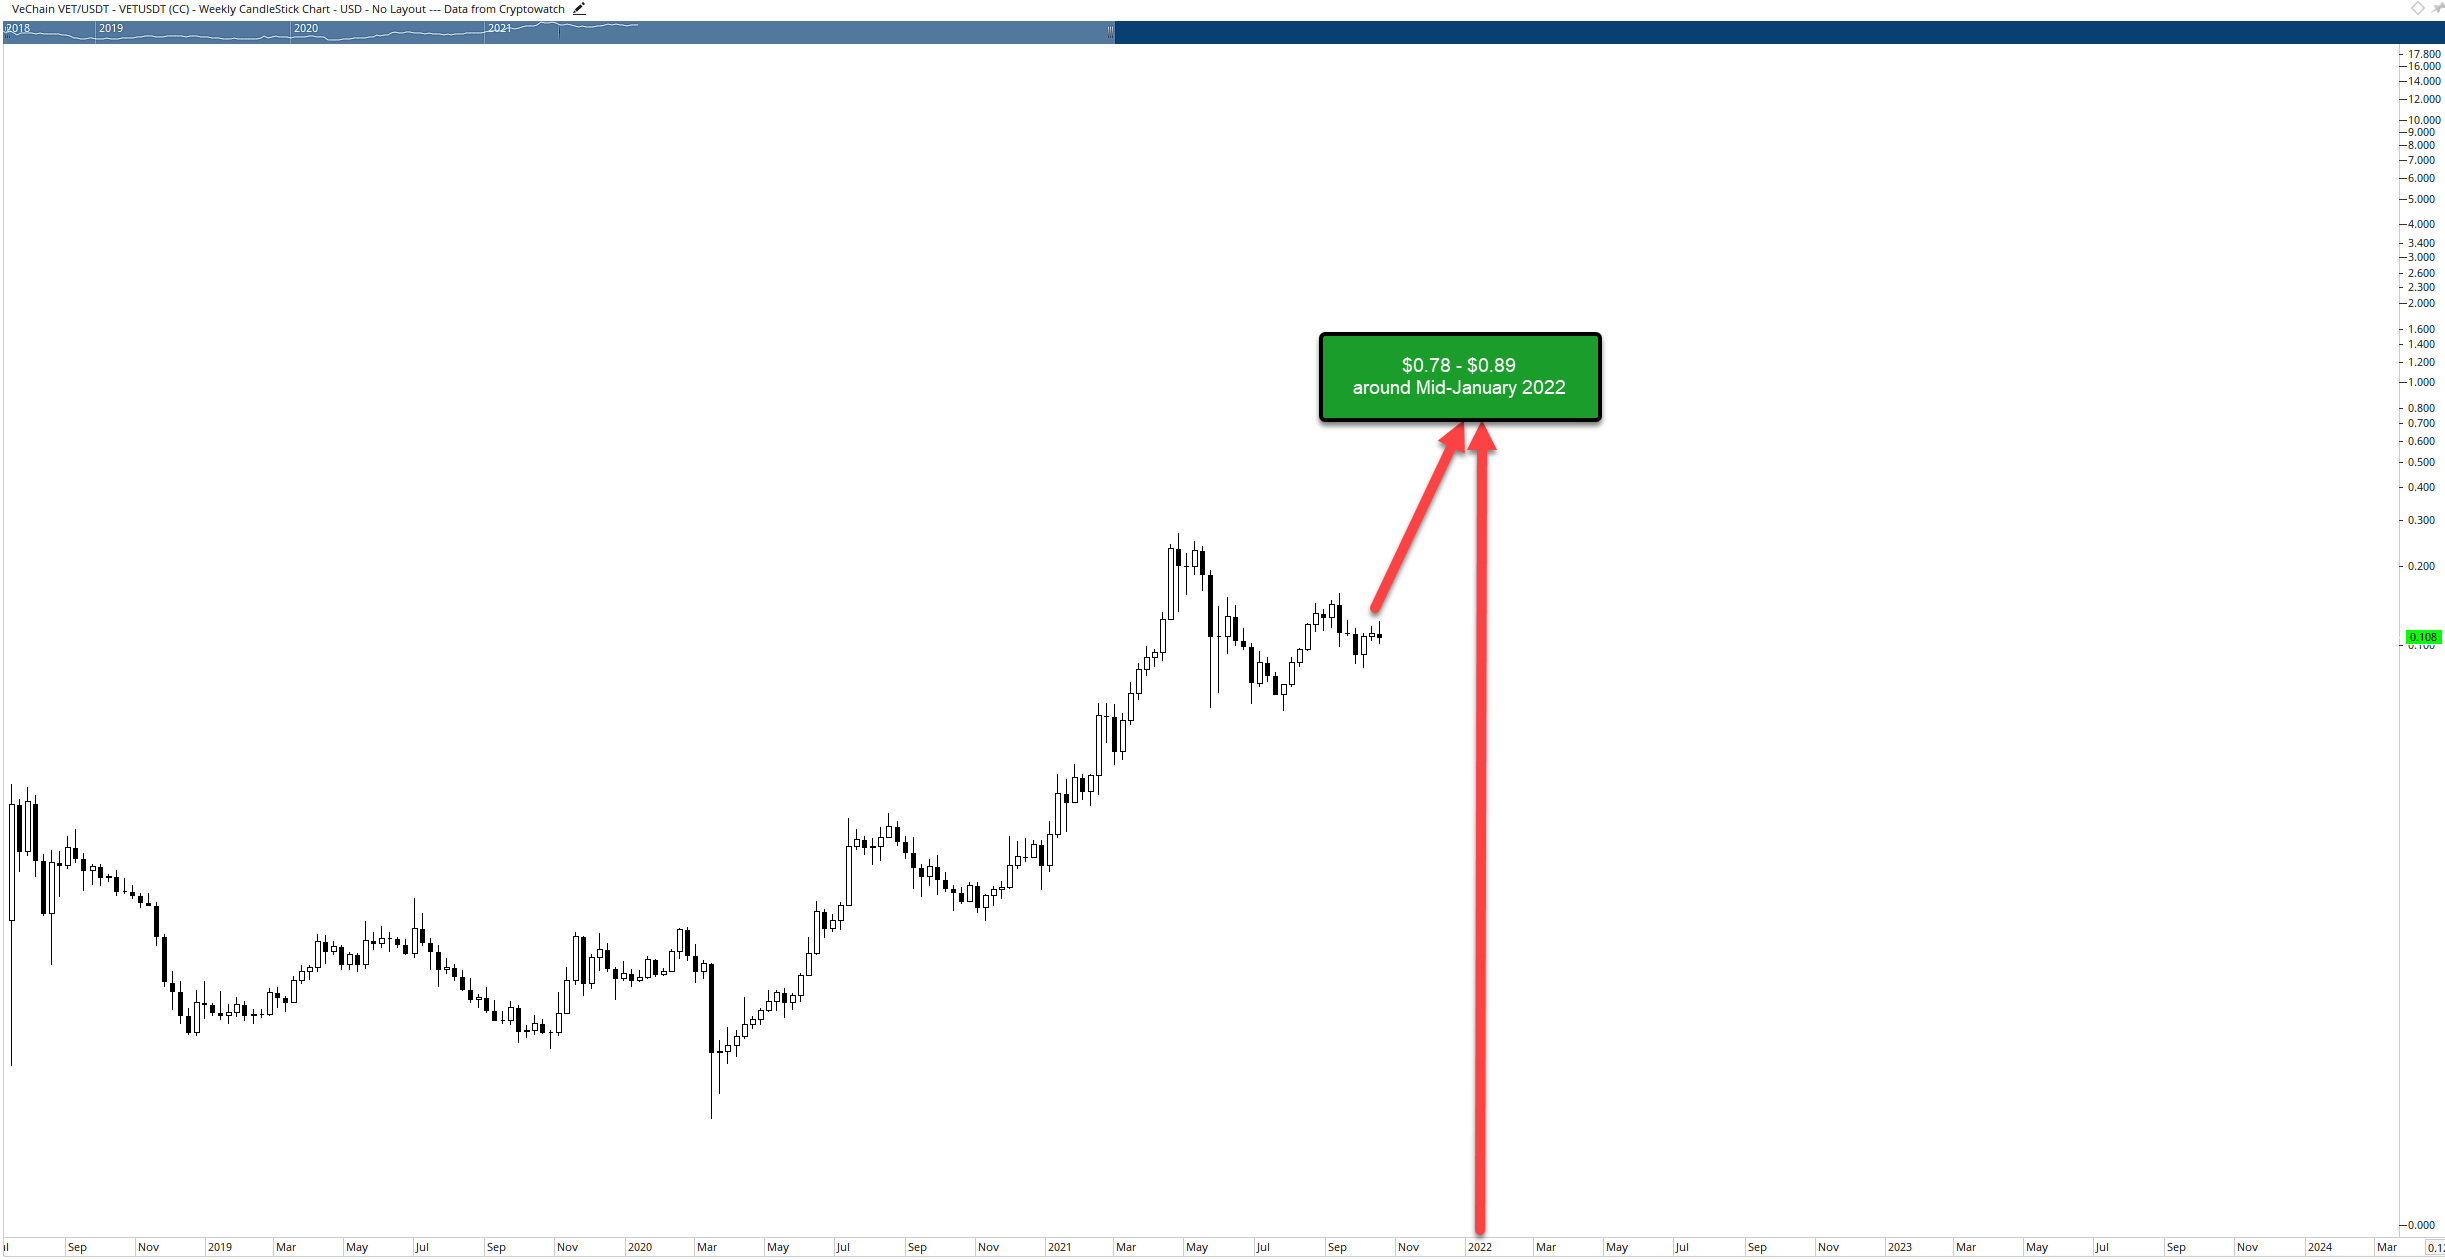
VET/USDT Time and Price
Combining time and price analysis is not meant to provide an exact VeChain price level or an exact date. Instead, the purpose of time and price projections is to give investors and traders an idea of a price range that may be important in the future and a corresponding date range of importance.
The conclusion is that a new all-time high could be found around mid-January 2022 within the price range of $0.78 to $0.89. Additionally, there is a high likelihood that a new minor swing low may appear during the first week of November 2021.
Author

Jonathan Morgan
Independent Analyst
Jonathan has been working as an Independent future, forex, and cryptocurrency trader and analyst for 8 years. He also has been writing for the past 5 years.



