Litecoin Technical Analysis: LTC/USD re-approaching the catastrophic 9 month lows, as the bears look at taking out the $70 level, which could be devastating for the price
- Litecoin nursing losses of over 1.5%, as it continues to be hit with selling pressure.
- LTC/USD ran into strong resistance between $77-75, being forced to know defend $70 territory.
- Eyes are on a retest of the lows on 4th and 5th August, which marked the lowest level since November 2017 at $72.155.

LTC/USD 4-hour chart
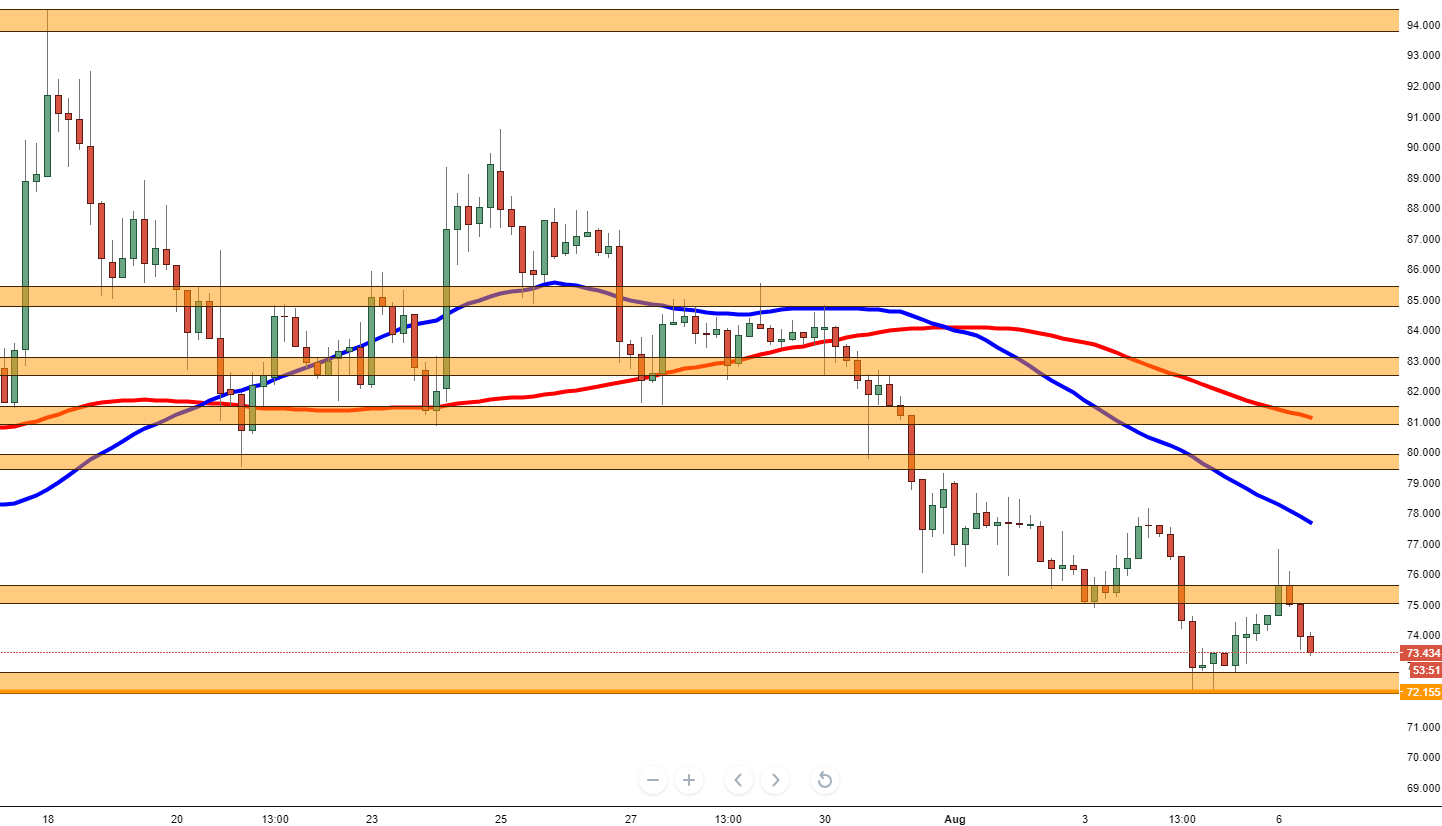
Spot rate: 73.434
Relative change: -1.60%
High: 76.789
Low: 73.280
Trend: Bearish
Support 1: 73.061, (support on 4-hour chart).
Support 2: 72.750, demand zone entrance.
Support 3: 72.155, 4th and 5th August low, (9-month low).
Resistance 1: 75.000, supply zone.
Resistance 2: 77.550, 50MA.
Resistance 3: 76.550, 100MA, supply zone & 21st July low.
Author

Ken Chigbo
Independent Analyst
Ken has over 8 years exposure to the financial markets. He started his career as an analyst, covering a variety of asset classes; forex, fixed income, commodities and equities.
More from Ken Chigbo


