Litecoin price hits $400 all-time high but LTC rally at risk of overheating

Litecoin (LTC) has broken the $400 mark reaching a new all-time high price of $414 on Bitstamp on May 10.
The problem with buying Litecoin is that it has become too expensive in a very little period. The world’s tenth-largest cryptocurrency by market capitalization is worth 215 percent more than it was at the beginning of this year, soaring from $124.42 to a new record high of $413.90.
Its massive rally has beaten traditional markets on a year-to-date (YTD) timeframe, with many independent analysts now predicting the move to extend towards $500.
Rotational trading
Eye-popping returns in the Litecoin market came on the heels of a broad upside move in the cryptocurrency market. The silver crypto’s top altcoin rivals, including Ether, XRP, Cardano, and many others, posted better profits, with Dogecoin, a joke cryptocurrency, rising by more than 17,000 percent YTD at one point in time.
Jason Lau, chief operating officer at OKCoin — a San Francisco-based crypto service business, highlighted a brewing inverse correlation between Litecoin and Dogecoin, noting that the DOGE/USD exchange rates dropped by 12% in the period that saw the LTC/USD exchange rates popping higher by 12%.
Meanwhile, the Litecoin Dominance Index, a metric that measures Litecoin’s strength against the rest of the cryptocurrency market, increased from 0.96% on Sunday to as high as 1.11% on Monday. That further reflects a sentimental shift to the Litecoin markets as other alternative cryptocurrency rallies show signs of cooling off.
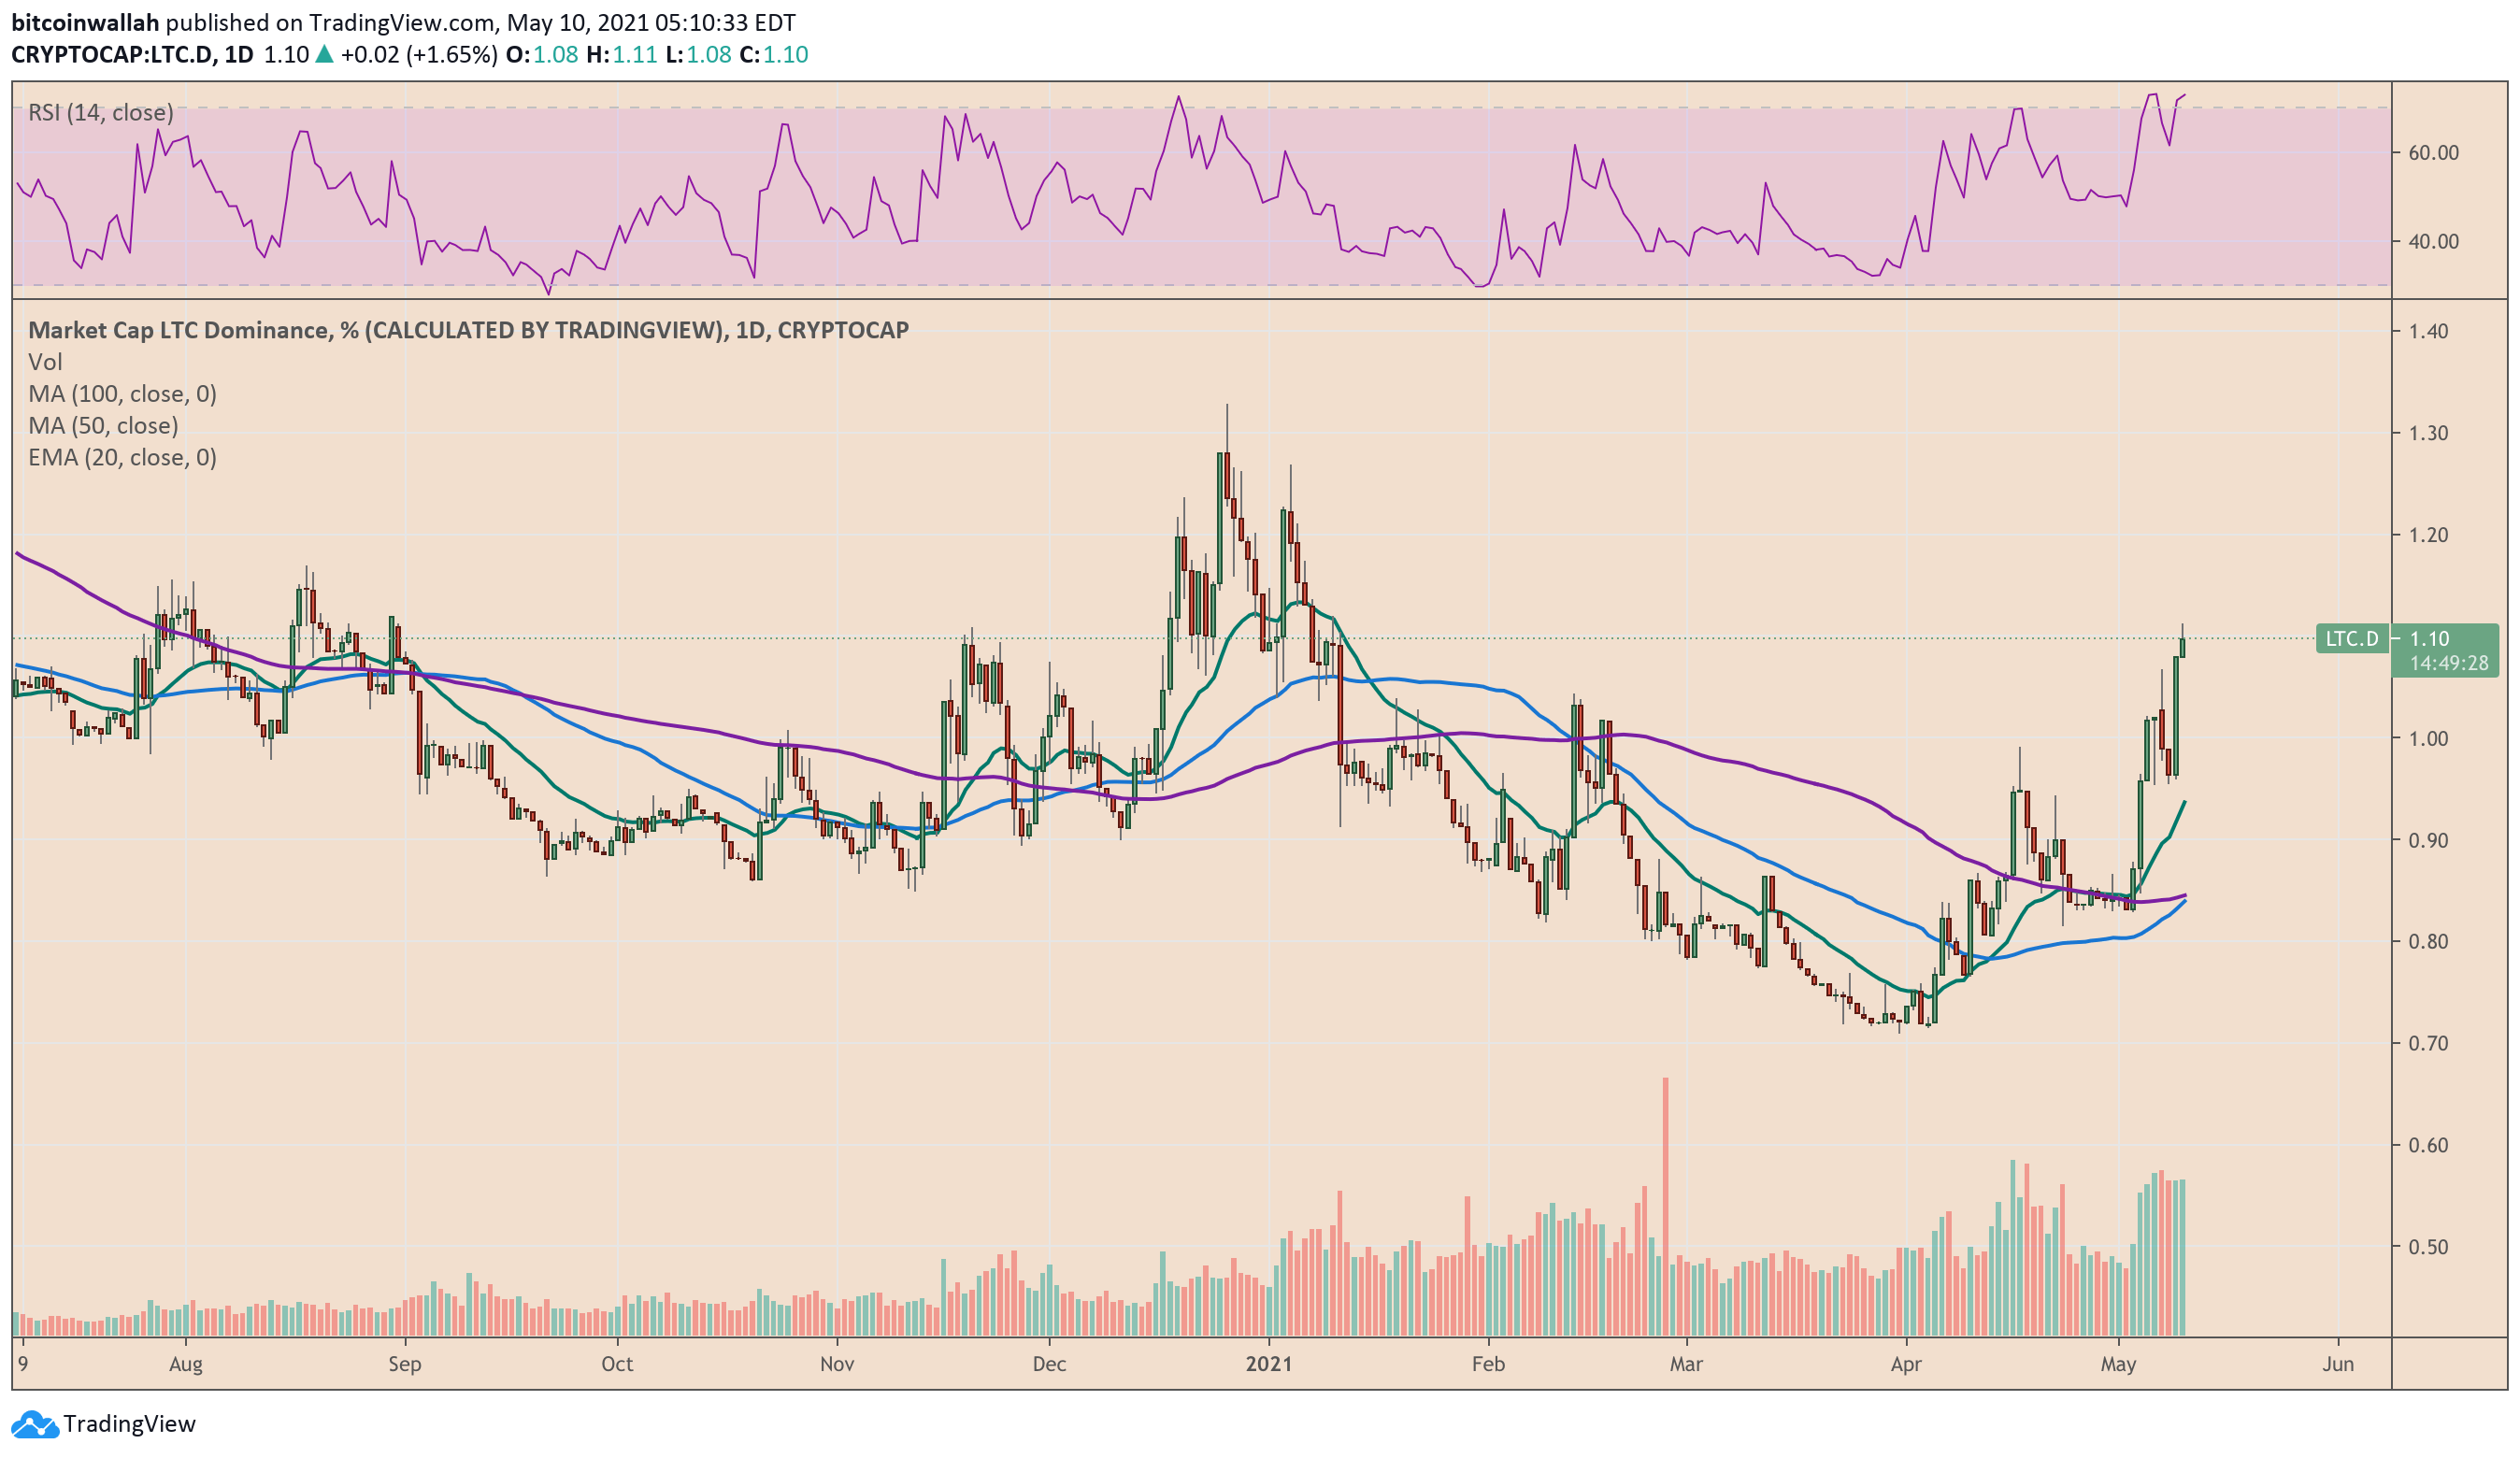
Litecoin Dominance Index recovers amid rotational trading. Source: LTC.D on Tradingview.com
But Litecoin now grapples with the same overvaluation risks that caused the Dogecoin price to crash by as much as 33% in the previous sessions. At the core of this bearish analogy lies a classic momentum oscillator indicator, dubbed as the Relative Strength Index (RSI), that has historically predicted potential price reversals in global markets. It now tells the same story about Litecoin.
Litecoin overbought?
The LTC/USD daily chart shows its RSI at an inflection level near 79.02. That is 9 points above the overbought threshold, which has earlier led to price corrections.
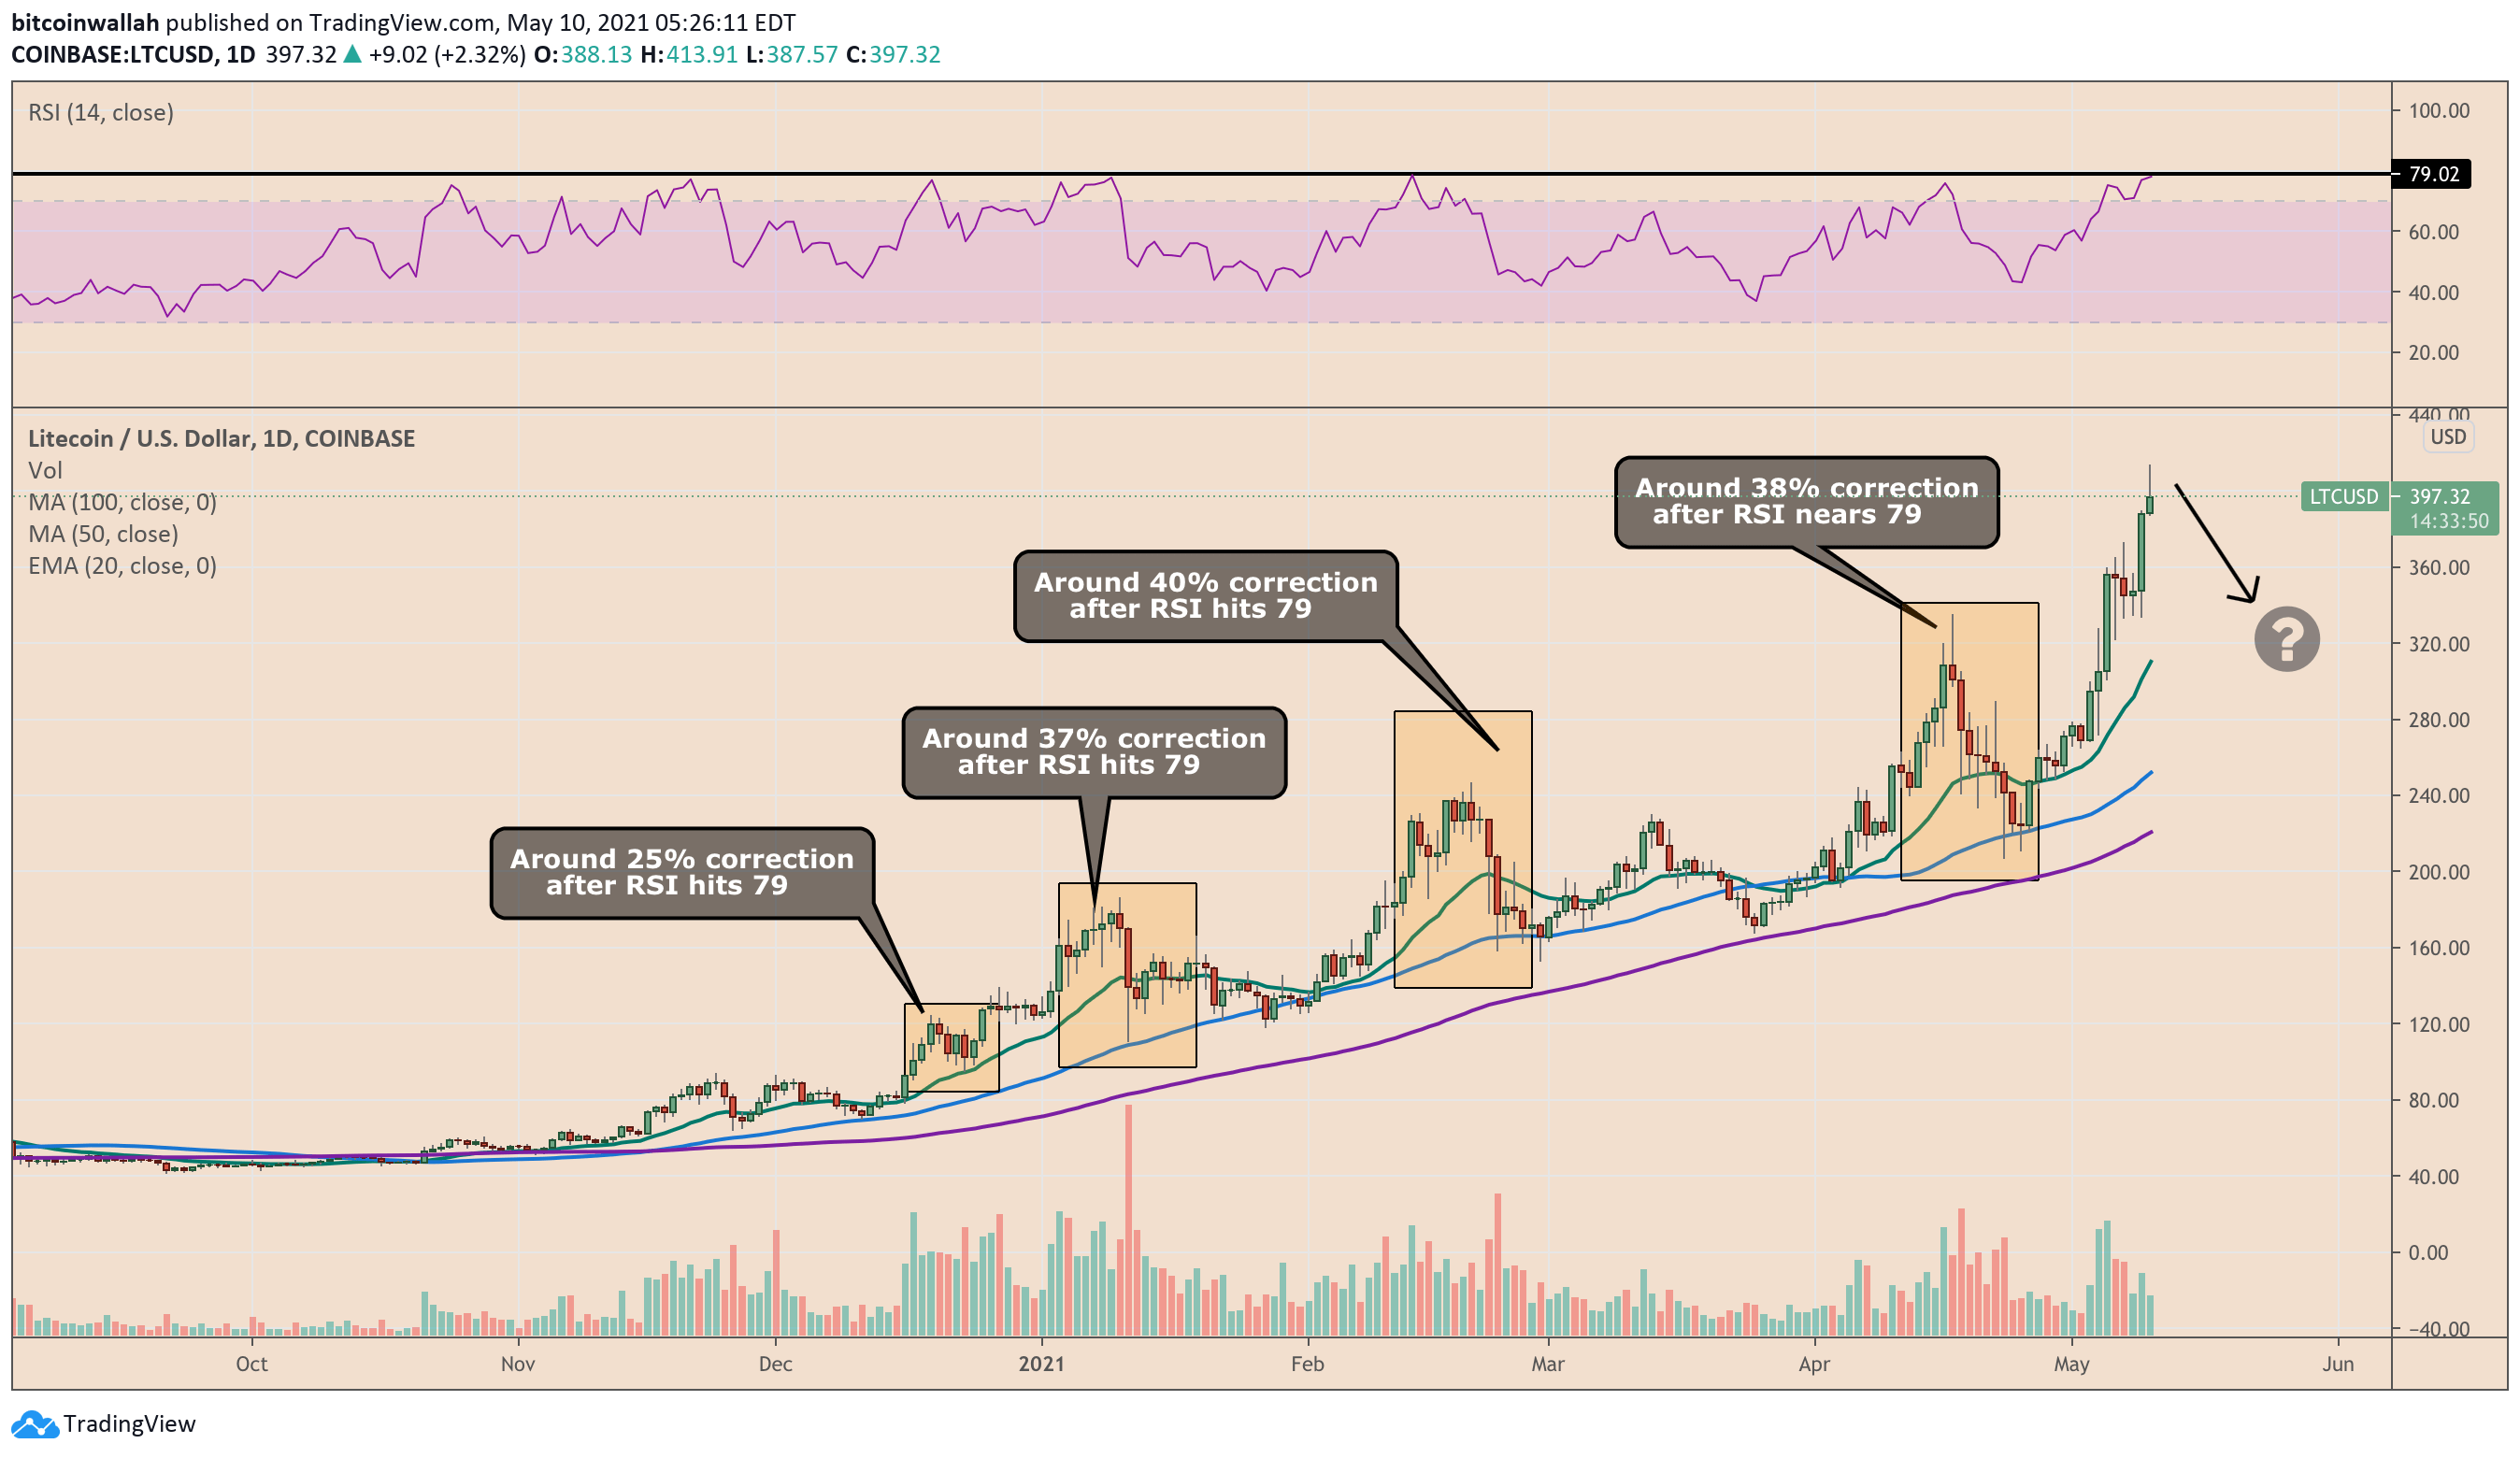
Litecoin price's response to higher RSI levels in recent history. Source: LTCUSD on Tradingview.com
Typically, a short-term trend reversal in the Litecoin market — when its RSI tops out — leads the price to test the 20-day exponential moving average (the green wave) as interim support. Meanwhile, an extended sell-off prompts traders to treat the 50-day simple moving average (the blue wave) acting as the primary downside target.
Therefore, a potential pullback following the recent explosive move risks sending LTC/USD to $252-$310 based on current moving average valuations.
Macroeconomic catalysts
Away from technicals, the macroeconomic catalysts continue to support cryptocurrency markets on the whole.
A study conducted by Charles Schwab showed that more than 51 percent of millennials and Gen Z investors would more likely invest in cryptocurrencies than traditional stocks. Their interests in the emerging digital assets sector have surged in the wake of inflation and dollar devaluation fears, especially as the central banks around the world respond to the coronavirus pandemic with easing monetary policies.
The Federal Reserve, for instance, has clarified that it would continue its $120-billion monthly asset purchase program while maintaining benchmark rates near zero at least until 2023. That has reduced the opportunity costs of holding traditional safe-havens like bonds and dollars among regional investors.
Meanwhile, the correlation between Bitcoin (BTC) and Litecoin stands near 0.40, according to data collected from Crypto Watch.
Author

Cointelegraph Team
Cointelegraph
We are privileged enough to work with the best and brightest in Bitcoin.


