Litecoin price gears for a rally as LTC market cap hits $6 billion
- Litecoin price indicates a brewing recovery rally after tagging a crucial accumulation zone.
- Despite the broader market gloom, LTC market cap has hit $6 billion, solidifying the Bitcoin fork’s 12th position on CoinMarketCap.
- The altcoin’s year-to-date performance bolsters this outlook, up by around 15%, with its one-year record showing a 90% climb.

Litecoin (LTC) price indicates a brewing recovery rally after a steep decline beginning early June. The Bitcoin (BTC) fork, like the rest of the altcoins, has endured a bear market but was spared the recent attack by the US Securities and Exchange Commission (SEC). Notably, LTC features among the few high-market capitalization tokens that were not branded “security” by the financial regulator.
Also Read: Bitcoin adds nearly 50,000 millionaires this year so far despite US regulatory crackdown
Litecoin price hints at an incoming recovery rally
Litecoin (LTC) price is down almost 20% since early June amid increasing volatility in the LTC market. Nevertheless, the lite version of the Bitcoin protocol remains up a staggering 90% since June 13, 2022 (one year ago), and around 15% since the year started. Overall, this indicates a bullish outlook, solidified by what appears to be a swift direction change in the making and the fact that LTC has hit $6 billion in market capitalization despite the overall bearishness in the market.
Based on the daily chart of the LTC/USDT trading pair below, Litecoin price tagged the upper boundary of the demand zone on June 10, suggesting a trend reversal was underway. This position was bolstered by the slight signs of changes already manifesting and has surged 0.78% in the past day. Over the last three days, the token is up 5% to the current market value of $77.34.
Notably, a demand zone is a support area where traders buy. Once an asset touches this zone, the ensuing buying pressure could fuel a rally north.
With an increasing demand for the altcoin, Litecoin price could ascend, breaking above the 100-, 50-, and eventually the 200-day Simple Moving Averages (SMA) at $85.82, $87.53, and $87.89, respectively. LTC could tag the $101.93 resistance level in a highly bullish case, clearing the path for an extended rally toward the May 22 highs. Such a move would constitute a 30% climb.
The bullish outlook is supported by the position of the Relative Strength Index (RSI) after it deflected from the downside. Notably, its position at 33 indicates LTC is close to oversold, and a pullback might be underway prospectively as traders buy the dip.
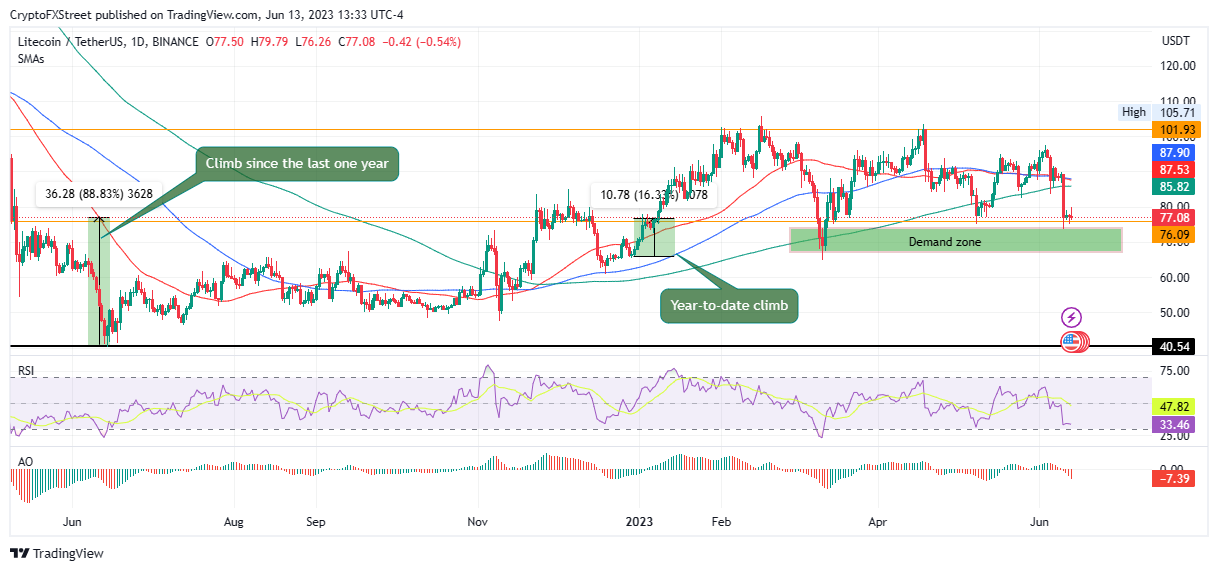
LTC/USDT 1-Day Chart
Conversely, if sellers overpower bulls, Litecoin price could shatter past the demand zone, invalidating it and making it a breaker block. This is basically a failed demand zone, or simply an order block that has failed to hold as a level. The move could see LTC drop to the psychological $60.00, or in the dire case, tag $50.00.
For insight, a breaker forms during a downtrend when the asset price takes out liquidity at the highs. To open a profitable short position, investors should wait for Litecoin price to retrace back to the breaker block.
Author

Lockridge Okoth
FXStreet
Lockridge is a believer in the transformative power of crypto and the blockchain industry.


