|

Litecoin Price Analysis: LTC/USD currently sandwiched between the SMA 20 and SMA 50 curves

  • LTC/USD had a bearish start to Thursday, as price consolidates below $44.
  • The Elliott Oscillator shows six straight red sessions.
  • LTC/USD faces strong resistance levels at SMA 50, $44.50 and $45.80. 

LTC/USD daily chart

LTC/USD daily chart

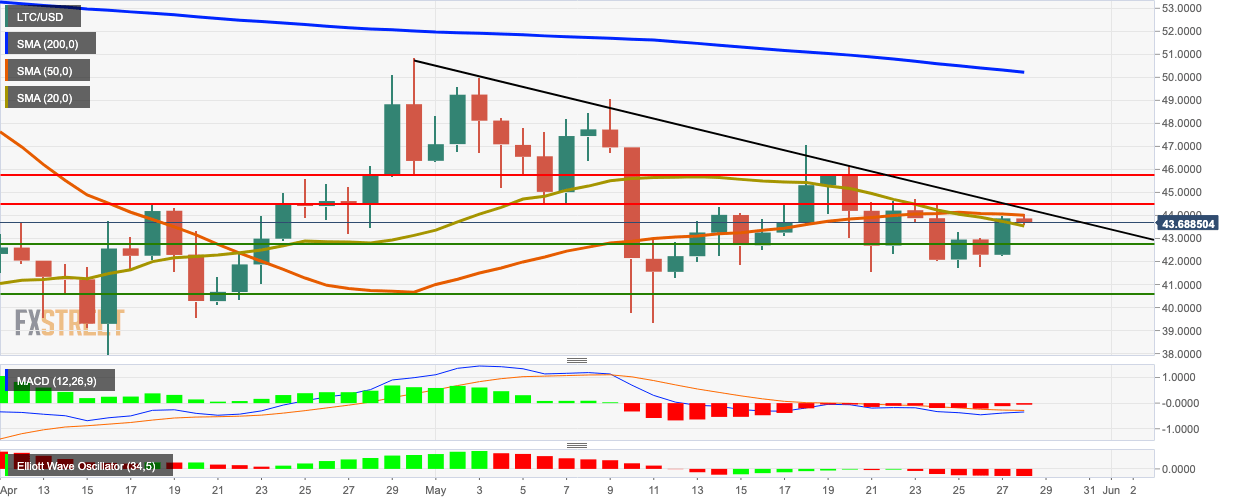
LTC/USD fell from $43.87 to $43.67 in the early hours of Thursday and is currently sandwiched between SMA 20 and SMA 50. The Elliott Oscillator has had six straight red sessions. The signal line has touched the MACD line, which indicates a reversal of bearish market momentum.

LTC/USD faces strong resistance levels at SMA 50, $44.50 and $45.80. On the downside, healthy support levels lie at SMA 20, $42.75 and $40.63.

Key levels

LTC/USD

Overview
Today last price43.7546
Today Daily Change-0.1187
Today Daily Change %-0.27
Today daily open43.8733
 
Trends
Daily SMA2043.7414
Daily SMA5044.0662
Daily SMA10046.982
Daily SMA20050.3676
 
Levels
Previous Daily High43.993
Previous Daily Low42.253
Previous Weekly High47.0866
Previous Weekly Low41.5866
Previous Monthly High50.8723
Previous Monthly Low37.1813
Daily Fibonacci 38.2%43.3283
Daily Fibonacci 61.8%42.9177
Daily Pivot Point S142.7532
Daily Pivot Point S241.6331
Daily Pivot Point S341.0132
Daily Pivot Point R144.4932
Daily Pivot Point R245.1131
Daily Pivot Point R346.2332


Author

Rajarshi Mitra

Rajarshi Mitra

Independent Analyst

Rajarshi entered the blockchain space in 2016. He is a blockchain researcher who has worked for Blockgeeks and has done research work for several ICOs. He gets regularly invited to give talks on the blockchain technology and cryptocurrencies.

More from Rajarshi Mitra
Share:

Editor's Picks

Grass 20% bullish breakout defies broader market weakness

Grass (GRASS) is edging up above $0.30 at the time of writing on Monday. The token’s notable 20% intraday surge stands out amid heightened volatility in the broader crypto market.

XRP slides as US-Iran war weakens sentiment

Ripple remains under pressure, trading around $1.35 at the time of writing on Monday. The remittance token extended its down leg to $1.27 on Saturday after the US, in collaboration with Israel, launched attacks on Iran, killing the nation’s Supreme Leader, Ali Khamenei.

Crypto Today: Bitcoin pares losses, Ethereum and XRP drift lower as Middle East conflict pressures risk assets

Bitcoin, Ethereum and Ripple remain on edge as the Israel-US war on Iran risk-off sentiment. The Crypto King trades above $66,000 at the time of writing on Monday, but is struggling to break through the seller congestion around $67,000.

Bitcoin on brink of breakdown amid US-Iran war

Bitcoin (BTC) remains under pressure near the key support level of $65,700. Trading at $66,400 at the time of writing on Monday, a breakdown below this critical level would suggest a deeper correction ahead.

Bitcoin Price Annual Forecast: BTC holds long-term bullish structure heading into 2026

Bitcoin (BTC) is wrapping up 2025 as one of its most eventful years, defined by unprecedented institutional participation, major regulatory developments, and extreme price volatility.

Bitcoin: Another month of losses, and it’s been five

Bitcoin (BTC) price is stabilizing around $68,000 at the time of writing on Friday, but the Crypto King is poised to close February on a fragile footing, marking its fifth consecutive month of losses since October and a rare start to the year with back-to-back monthly corrections.