|

Litecoin Price Analysis: LTC/USD bulls push the price into the $60-zone

  • Over the last three days, LTC/USD jumped from $53.25 to $61.
  • The Elliott Oscillator had a green session, following nine straight red sessions.

LTC/USD daily chart

LTC/USD daily chart

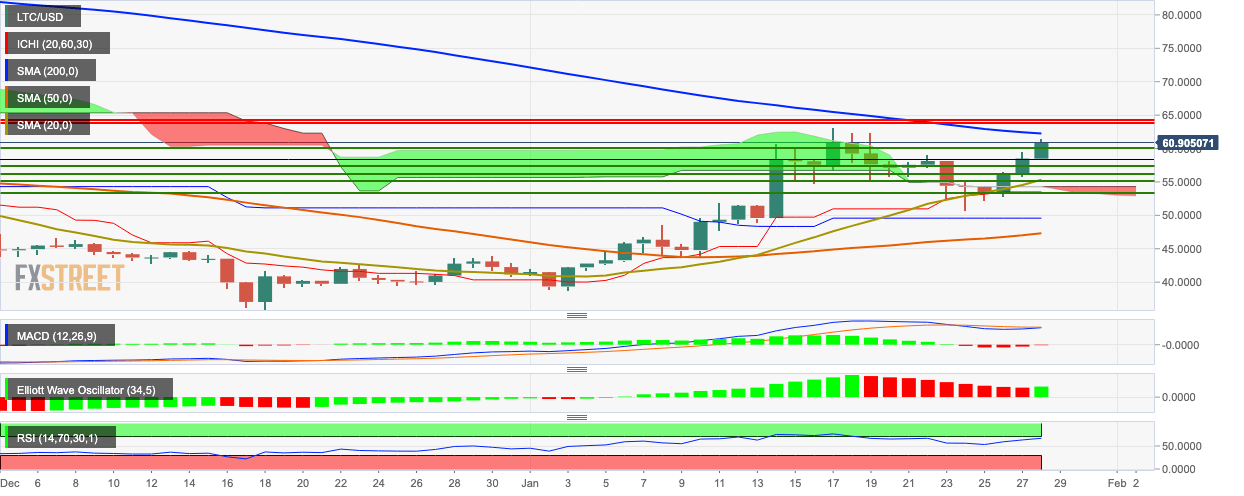
LTC/USD bulls took charge of the market over the last three days. The market bounced off the $53.25 support level and jumped up to $61, crossing the $60-barrier, in the process. The price is hovering above the red Ichimoku cloud and is sandwiched between the SMA 200 and SMA 20 curves. The MACD indicates a reversal of bearish momentum, while the Elliott Oscillator had a green session, following nine straight red sessions. The RSI indicator spiked from 53.36 to 67.20 over the last three days, showing that the price still has more scope for growth before it faces inevitable bearish correction.
 

Author

Rajarshi Mitra

Rajarshi Mitra

Independent Analyst

Rajarshi entered the blockchain space in 2016. He is a blockchain researcher who has worked for Blockgeeks and has done research work for several ICOs. He gets regularly invited to give talks on the blockchain technology and cryptocurrencies.

More from Rajarshi Mitra
Share:

Editor's Picks

Grass 20% bullish breakout defies broader market weakness

Grass (GRASS) is edging up above $0.30 at the time of writing on Monday. The token’s notable 20% intraday surge stands out amid heightened volatility in the broader crypto market.

XRP slides as US-Iran war weakens sentiment

Ripple remains under pressure, trading around $1.35 at the time of writing on Monday. The remittance token extended its down leg to $1.27 on Saturday after the US, in collaboration with Israel, launched attacks on Iran, killing the nation’s Supreme Leader, Ali Khamenei.

Crypto Today: Bitcoin pares losses, Ethereum and XRP drift lower as Middle East conflict pressures risk assets

Bitcoin, Ethereum and Ripple remain on edge as the Israel-US war on Iran risk-off sentiment. The Crypto King trades above $66,000 at the time of writing on Monday, but is struggling to break through the seller congestion around $67,000.

Bitcoin on brink of breakdown amid US-Iran war

Bitcoin (BTC) remains under pressure near the key support level of $65,700. Trading at $66,400 at the time of writing on Monday, a breakdown below this critical level would suggest a deeper correction ahead.

Bitcoin Price Annual Forecast: BTC holds long-term bullish structure heading into 2026

Bitcoin (BTC) is wrapping up 2025 as one of its most eventful years, defined by unprecedented institutional participation, major regulatory developments, and extreme price volatility.

Bitcoin: Another month of losses, and it’s been five

Bitcoin (BTC) price is stabilizing around $68,000 at the time of writing on Friday, but the Crypto King is poised to close February on a fragile footing, marking its fifth consecutive month of losses since October and a rare start to the year with back-to-back monthly corrections.