|

Litecoin price analysis: LTC/USD breaks out to test $165, but retreats for a fresh start above $160

Litecoin price is forming another bullish flag pattern, upside capped below $165.

Indicators; the MACD and the RSI highlight a bear momentum in the short-term.

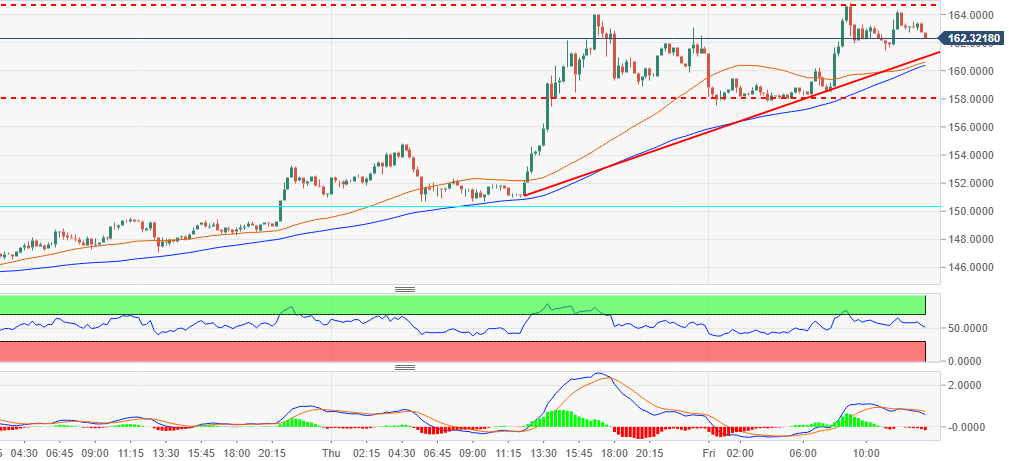
Litecoin price has tested the resistance level at $165 but still has not been able to break past the selling pressure. LTC/USD is up more than 5% in the last 24 hours on Thursday, although it lacks the catalyst to support the gains. The price is forming a second bullish flag pattern on the 15’ timeframe chart pending an upside breakout. Recently Litecoin sought refuge at $158, preventing further declines.

The moving averages on the same chart show bullish signals in the near-term as the weekend approaches. Other indicators like the MACD and the RSI highlight a bear momentum in the short-term. A growing bear momentum is in progress while $162 is an immediate support. Below this level, the bullish trend line will support the price. Moreover, the next targets on the downside are $160 and $158 respectively.

On the upside, LTC/USD will face resistance at $164 as it retraces its step upwards. Significantly, $165 is a major hurdle to the upside, but it also good to note that the bulls are looking forward to $170.

LTC/USD 15’ chart

Author

John Isige

John Isige

FXStreet

John Isige is a seasoned cryptocurrency journalist and markets analyst committed to delivering high-quality, actionable insights tailored to traders, investors, and crypto enthusiasts. He enjoys deep dives into emerging Web3 tren

More from John Isige
Share:

Editor's Picks

BNB Price Forecast: Correction extends as bearish signals point to deeper losses

BNB, formerly known as Binance Coin, continues to extend its losses, trading below $573 at the time of writing on Friday, losing over 7% so far this week. Muted institutional demand, rising short bets and falling Open Interest signal growing downside bias.

Bitcoin network activity hits new high despite stalled prices — CryptoQuant
Bitcoin's onchain activity has climbed to its strongest level of 2026 even as the top crypto continues to trade under bearish pressure, according to a Thursday report from CryptoQuant. The recovery in network activity is being driven almost entirely by transaction volume rather than higher-value economic transfers.
Cardano Price Forecast: Derivatives and on-chain losses compound bearish trend

Cardano (ADA) remains under pressure, trading below $0.165 and losing over 11% so far this week. Weakening derivatives metrics and deteriorating on-chain data support further correction on ADA. Cardano derivatives metrics support a negative outlook.

Crypto Overview: Bitcoin extends decline amid US-Iran negotiation concerns – BCH, HYPE lead losses
The broader cryptocurrency market feels the weight of strained US-Iran negotiations, pushing Bitcoin (BTC) below $63,000 on Friday. Israeli missile strikes over Lebanon bend the first clause of the peace agreement, raising concerns over the renewed passage through the Strait of Hormuz.
Experts agree: Bitcoin nears bottom, but weak demand raises doubts
Bitcoin (BTC) is trading above $63,000 at the time of writing on Friday after rebounding from the key 200-week Simple Moving Average (SMA) near $62,000, a level widely viewed as key long-term support. The recovery may suggest that Bitcoin has found a floor after a sharp correction that spanned more than a month, but some warning signs persist.