|

Litecoin Price Analysis: LTC upside potential capped at $54

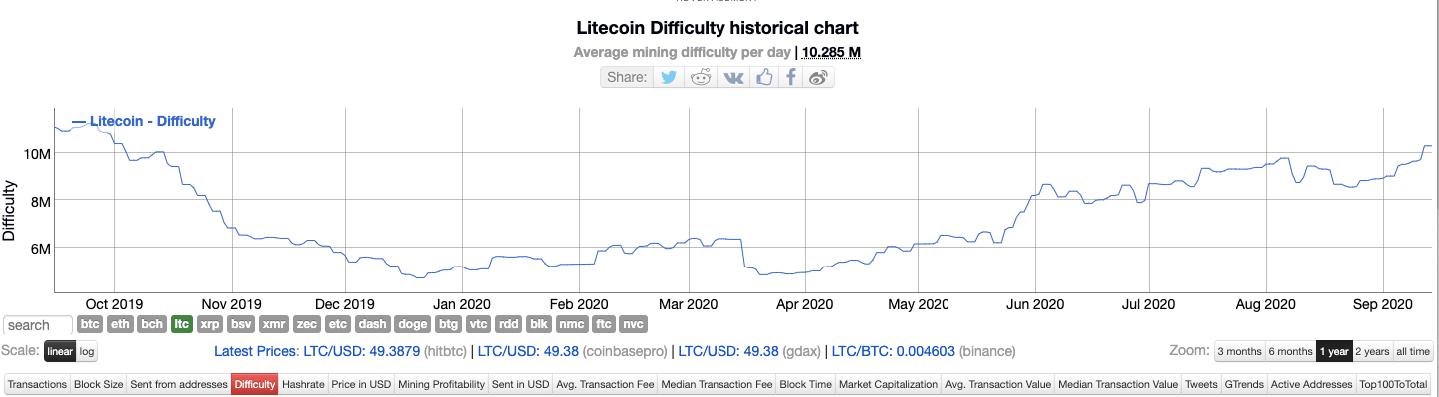
  • Litecoin network difficulty has reached its highest levels since October 2019.
  • The MACD also shows that market momentum is about to reverse from bearish to bullish.

LTC has been on an uptrend after it bounced up from the $47.24 support line and managed to go up to $49.44 over the last seven days. The buyers tried to break past the $50.85 resistance level in the interim but got immediately thwarted.

As of now, the goal for the buyers is pretty straight forward. The present candlestick is the green seven, meaning it still has some room to grow. The buyers must now aim to go above the $50.83, which it had previously failed to do so. The MACD also shows that market momentum is about to reverse from bearish to bullish, so that’s another positive sign.

LTC/USD daily chart

LTC/USD daily chart

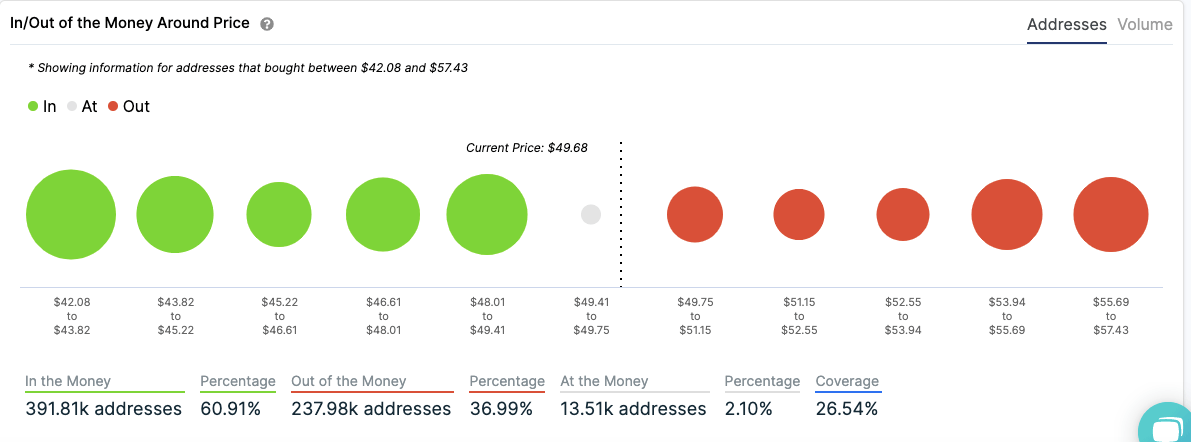
LTC IOMAP

fxsoriginal

The IOMAP is a pretty helpful tool that helps us realize the upside and downside potential of a particular asset. In this case, we can see that LTC can potentially go up to $53.94 before it encounters a strong resistance level. On the downside, the price is sitting on top of a healthy support level, so downside movement (for now) is somewhat limited.

LTC Network Metrics

Difficulty
fxsoriginal

For POW (proof-of-work) coins like Litecoin and Bitcoin, “difficulty” is a metric that determines how time-consuming the mining process is. It keeps in check the rate at which the blocks are getting mined. As you can see in the graph above, difficulty has reached its highest levels since October 2019.

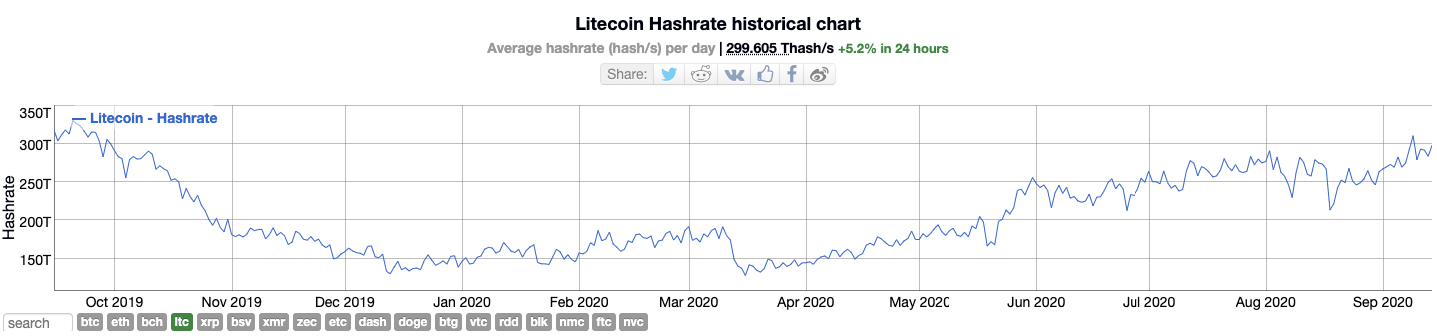
So, how have the miners responded to this? Pretty well, actually.

Hashrate
fxsoriginal

Hashrate is a metric that determines the computational ability of a network and is directly proportional to miner activity within the network. More the hashrate, more the speed and overall security. As you can see in the screenshot above, the hashrate has increased proportionally with the difficulty. This is an excellent sign for the bulls since a healthy network can attract more investments.

Key levels

LTC/USD

Overview
Today last price49.5926
Today Daily Change0.4892
Today Daily Change %1.00
Today daily open49.1034
 
Trends
Daily SMA2052.9169
Daily SMA5056.5242
Daily SMA10050.1397
Daily SMA20047.3888
 
Levels
Previous Daily High49.6702
Previous Daily Low47.1567
Previous Weekly High49.4809
Previous Weekly Low45.3063
Previous Monthly High68.9714
Previous Monthly Low51.615
Daily Fibonacci 38.2%48.71
Daily Fibonacci 61.8%48.1168
Daily Pivot Point S147.6166
Daily Pivot Point S246.1299
Daily Pivot Point S345.1031
Daily Pivot Point R150.1301
Daily Pivot Point R251.1569
Daily Pivot Point R352.6436


Author

Rajarshi Mitra

Rajarshi Mitra

Independent Analyst

Rajarshi entered the blockchain space in 2016. He is a blockchain researcher who has worked for Blockgeeks and has done research work for several ICOs. He gets regularly invited to give talks on the blockchain technology and cryptocurrencies.


More from Rajarshi Mitra
Share:

Editor's Picks

Why altcoin season isn't coming back — and what stole its capital

If, after two years of being frozen in ice, Katara and Sokka woke you up to the crypto market, it would seem like 100 years have passed. With Bitcoin soaring to record highs just over a year ago, everyone expected a routine altcoin season, where investors take profits from the top crypto to chase higher returns in altcoins.

Bitcoin Weekly Forecast: BTC shrugs off CLARITY Act setback and hawkish Fed

Bitcoin recovers, trading above $78,000 on Friday, but the 50-week SMA near $78,760 continues to cap its upside. A hawkish Fed outlook, escalating Middle East tensions, and the CLARITY Act's failure to advance in the US Senate could limit BTC upside.

Why Bitcoin's over 30% rebound doesn't mean the bear market cycle is done

BTC has staged a strong recovery after falling to a yearly low of $57,800 in July, gaining nearly 33% and recording two consecutive months of gains in July and August. Is this the start of a new bullish phase, or simply another recovery within a broader bear-market cycle?

Crypto Today: Bitcoin, Ethereum, XRP eye short-term breakout as bulls return

Bitcoin trades higher near $78,000 on Friday as bulls return after early-week macro uncertainty and regulatory headwinds. Ethereum aligns with the broader crypto market’s neutral-to-bullish outlook, holding support above $2,400 and gaining momentum for a short-term breakout at $2,500.

Bitcoin: BTC shrugs off CLARITY Act setback and hawkish Fed
Bitcoin (BTC) price action has remained resilient this week, trading above $78,000 at the time of writing on Friday, heading toward a key resistance zone. Institutional demand shows early signs of weakness, with spot Exchange Traded Funds (ETFs) on track for a second straight week of outflows, with over $420 million recorded through Thursday amid escalating Middle East tensions.