|

Litecoin (LTC/USD) forecasting the decline using Elliott Wave

In this article, we will look at the decline in LTCUSD from $132 to $90 which took almost a week to unfold. We will look at some Elliott wave charts presented to members and show how our members were prepared for this decline in Litecoin. We called a zigzag Elliott wave correction completed in Litecoin (LTCUSD) at $143.93 and called for the decline to resume. Let’s take a look at the chart from February 16, 2022 to begin with.

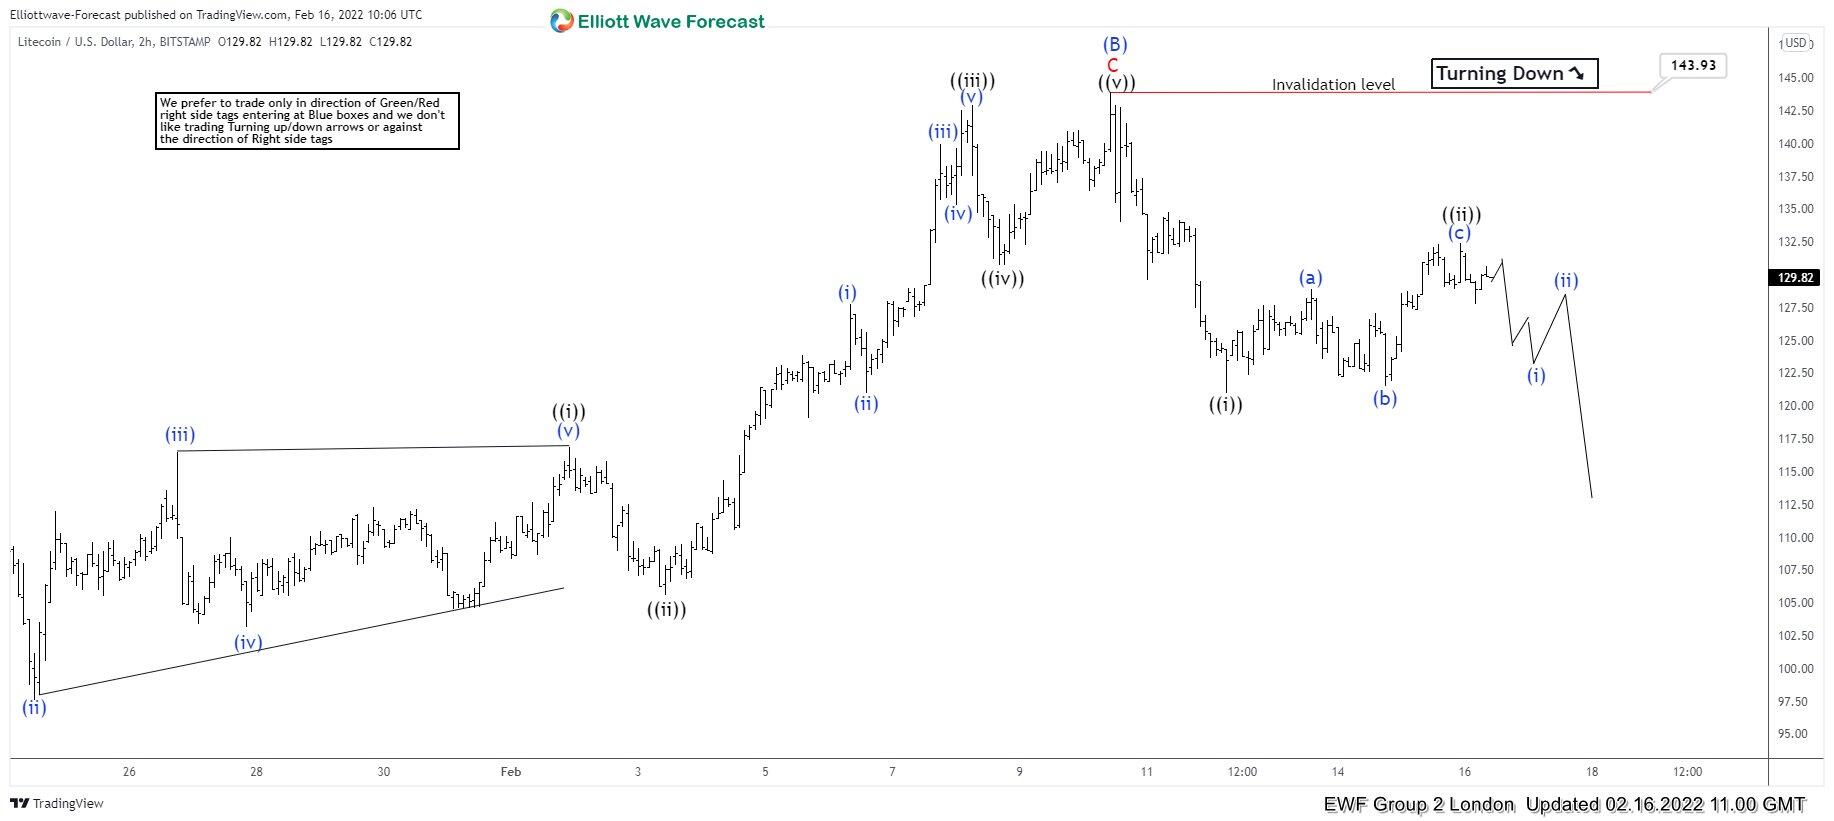
LTC/USD 1 hour Elliott Wave analysis – 16 February, 2022

Chart below shows wave (( i )) and (( ii )) completed and we expected the decline to resume in wave (( iii )) as far as prices stayed below wave (( ii )) high and more importantly below $143.93 high.

LTCUSD

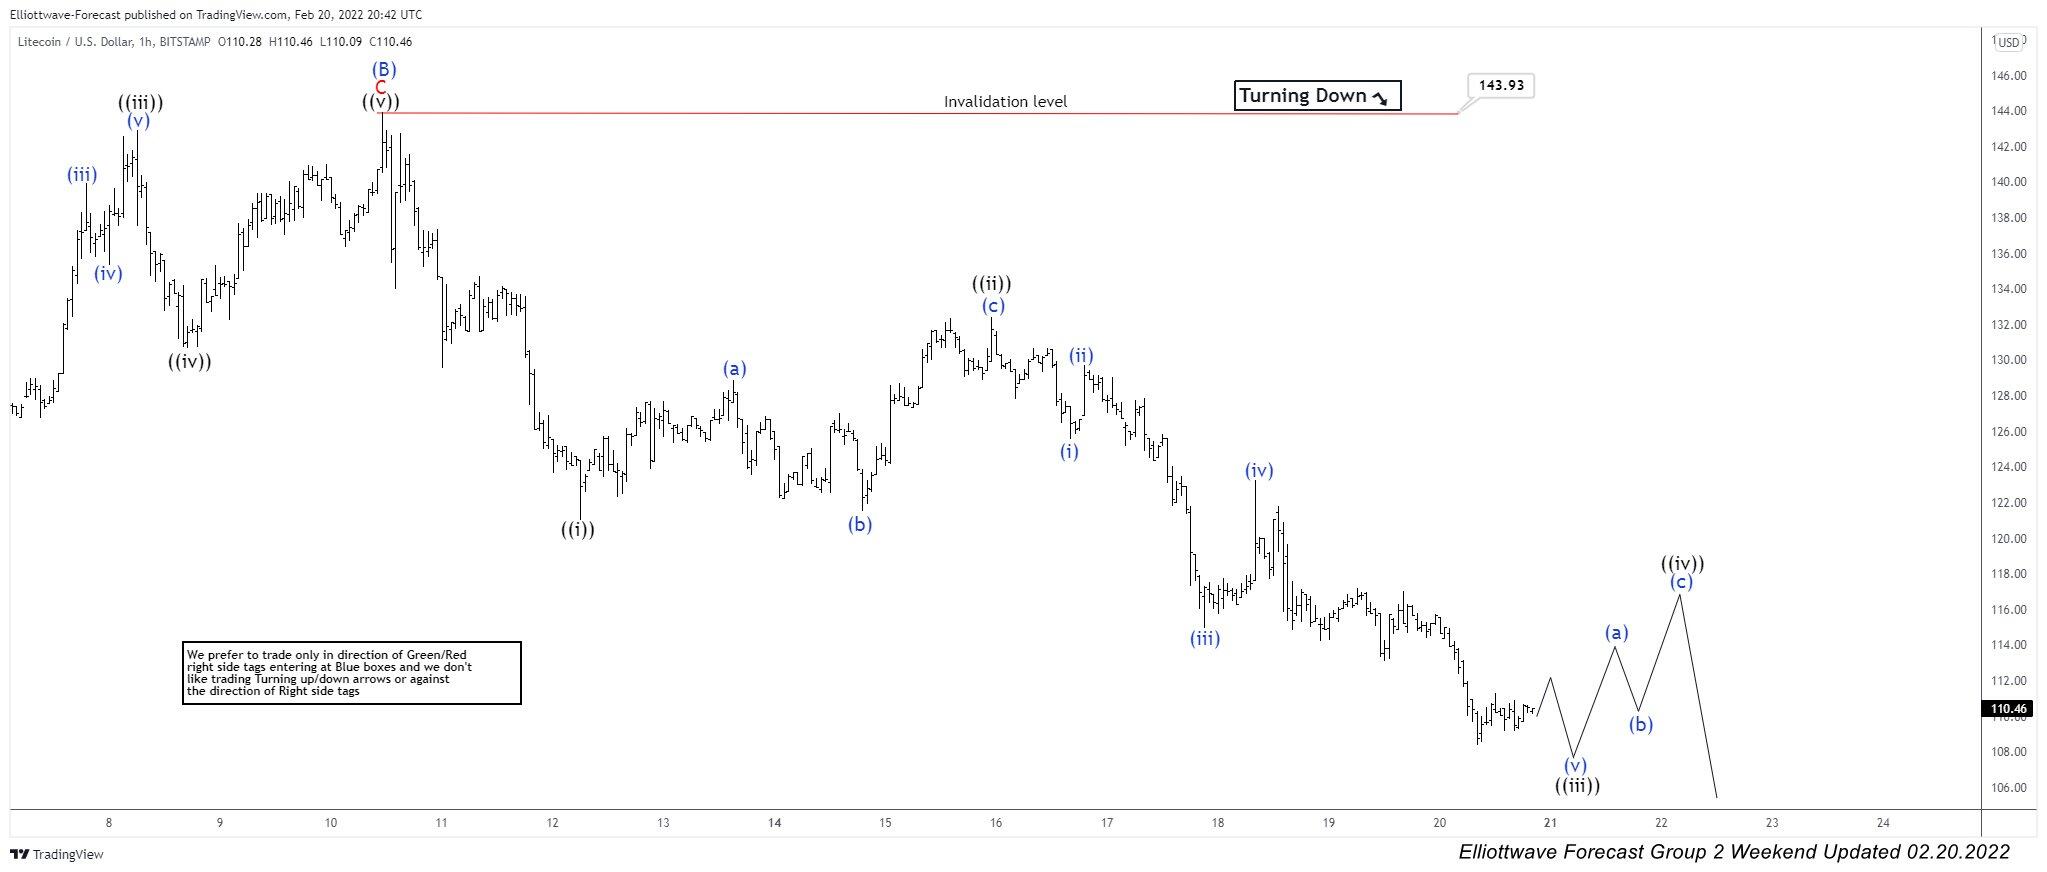
LTC/USD 1 hour Elliott Wave analysis – 20 February, 2022

Chart below shows decline resumed as expected and wave (( iii )) is nearing completion after which we expected a bounce in wave (( iv )) and another leg down to complete 5 waves decline from $143.93 high.

LTCUSD

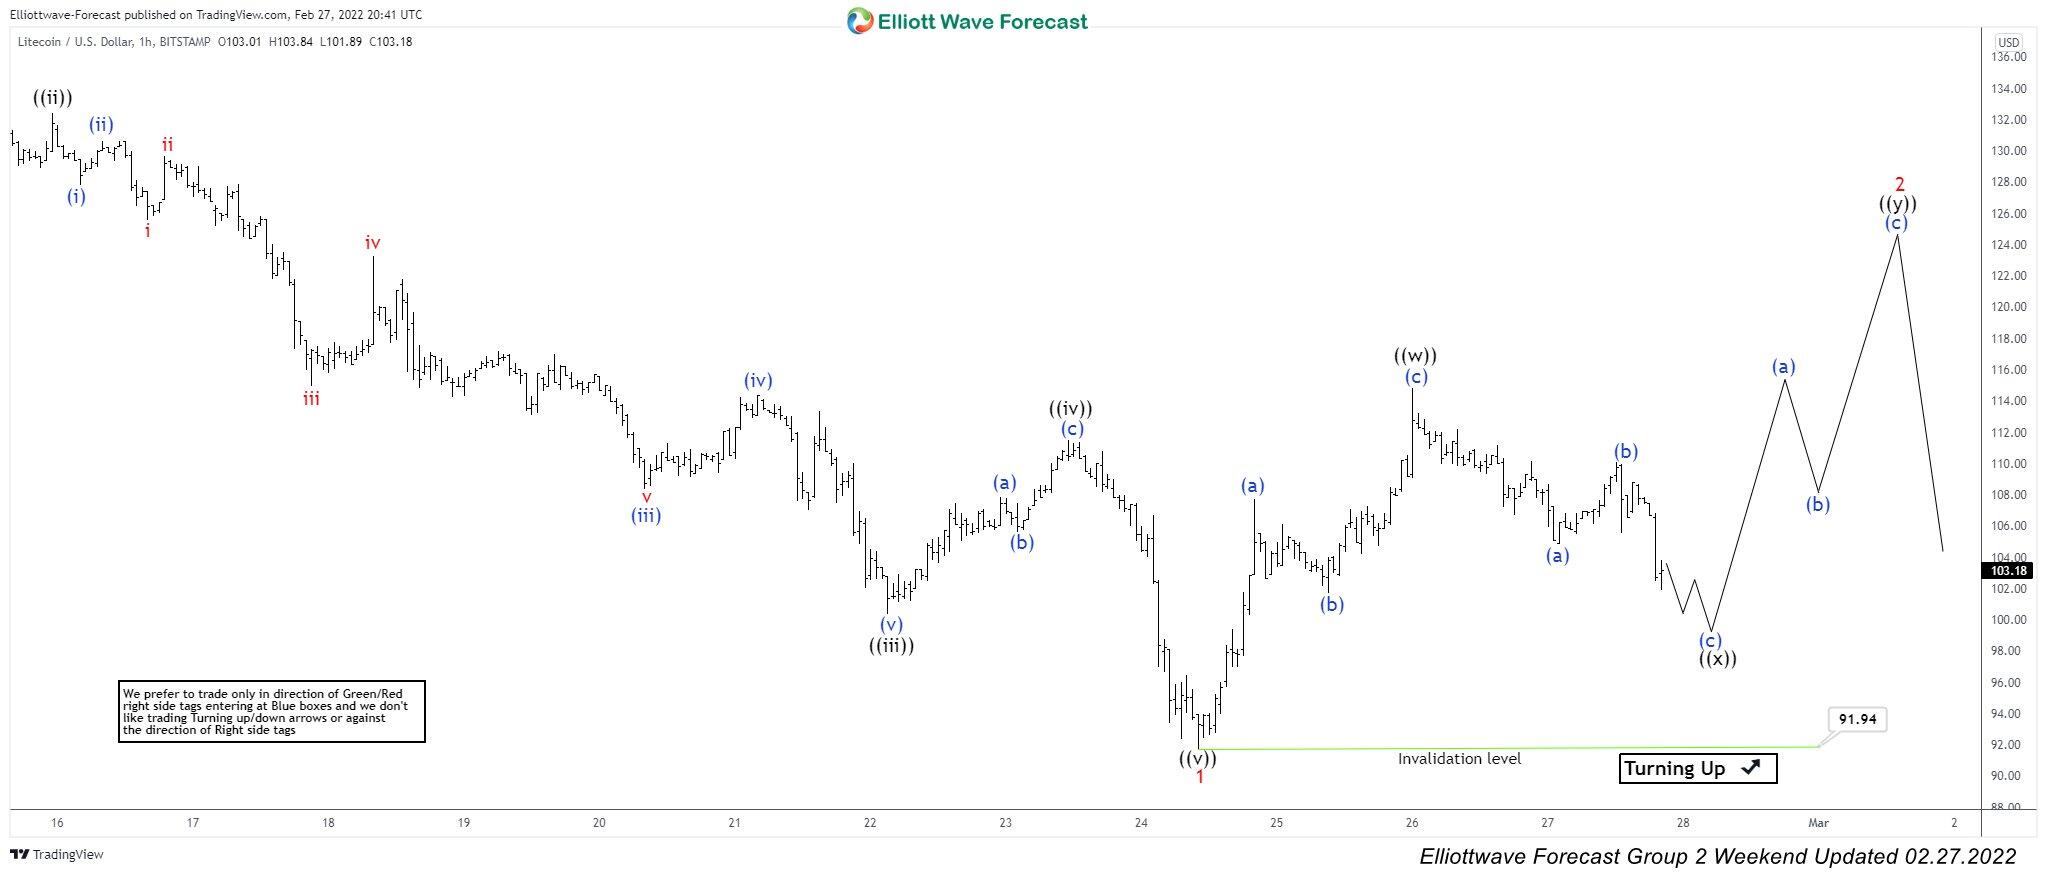
LTC/USD 1 hour Elliott Wave analysis – 27 February, 2022

Chart below shows Impulsive decline from wave (B) $143.93 high completed at $91.94 and as dips stay above this level, expect prices to extend higher to complete wave 2 before a turn lower again.

LTCUSD

Author

Elliott Wave Forecast Team

Elliott Wave Forecast Team

ElliottWave-Forecast.com

More from Elliott Wave Forecast Team
Share:

Editor's Picks

XRP holds $1.40 amid ETF inflows and stable derivatives market

Ripple trades under pressure, with immediate support at $1.40 holding at the time of writing on Tuesday. A recovery attempt from last week’s sell-off to $1.12 stalled at $1.54 on Friday, leading to limited price action between the current support and the resistance.

Crypto Today: Crypto market holds $2.4 trillion as bearish sentiment persists around Bitcoin, Ethereum, XRP 

The Crypto King, Bitcoin, is constrained below $70,000, with the price holding around $69,000. Altcoins, including Ethereum and Ripple, exhibit technical weakness but are holding above key support levels at $2,000 and $1.40, respectively.

Aster tests resistance as whale activity, perpetuals volume surge

Aster (ASTER) edges higher by over 7% at press time on Thursday, crossing above its 200-period Exponential Moving Average (EMA) on the 4-hour chart while testing a long-term resistance trendline on the daily.

Bitcoin slips below $69,000 as crypto market shows cautious stabilization

Bitcoin price is nearing the lower consolidation boundary, trading below $69,000 at the time of writing on Tuesday. A breakdown below this key level would suggest a correction toward $60,000. However, institutional and corporate demand support a short-term stabilization in BTC.

Bitcoin Price Annual Forecast: BTC holds long-term bullish structure heading into 2026

Bitcoin (BTC) is wrapping up 2025 as one of its most eventful years, defined by unprecedented institutional participation, major regulatory developments, and extreme price volatility.

Bitcoin: The worst may be behind us

Bitcoin (BTC) price recovers slightly, trading at $65,000 at the time of writing on Friday, after reaching a low of $60,000 during the early Asian trading session. The Crypto King remained under pressure so far this week, posting three consecutive weeks of losses exceeding 30%.