If Merge is a sell-the-news event, expect Ethereum price to reach $1,300
- Ethereum price development on a twelve-hour time frame indicates a bearish skew.
- Inventors can expect ETH to trigger a massive sell-off to $1,280 or lower.
- A twelve-hour candlestick close above $1,957 will create a higher high and invalidate the bearish thesis.

Ethereum price has been on a massive uptrend due to the upcoming software update to the underlying blockchain called “Merge.” This upgrade will allow it to transition from Proof-of-Work (PoW) to Proof-of-Stake (PoS).
The former is energy-intensive and is unfriendly to the environment as a result, but the latter does not make use of mining devices and therefore reduces its carbon footprint by multiple folds.
Is the Merge bullish?
Now that we have a basic understanding of what a Merge is, let’s take a closer look at how it affects the blockchain and its users. The general populace thinks that the Merge will increase the transaction speed, reduce gas fees, and triple the earnings via staking and so on.
This expectation, coupled with the triple halving narrative, has caused Ethereum price to skyrocket despite being in a discernable bear market. ETH, in particular, has more than doubled as it rallied 130% between June 18 and August 14.
However, the Ethereum Foundation published a blog, addressing these misconceptions and clearly stated -
- Merge will NOT reduce gas fees
- Staking earnings will NOT triple but 50% is possible
- Transactions speed will mostly remain the SAME
Regardless, speculators have managed to trigger a wild rally for Ethereum price. Let’s look at the technicals and if these gains are sustainable in a bear market.
Ethereum price tries to recover
Ethereum price has been on a downtrend since November 2021 and has dropped a whopping 81%, knocking it from $4,868 to $880 in just 220 days. After forming a bottom on June 18 at $880, ETH has rallied 130% in under two months to set a swing high at $2,031.
After this impressive uptrend, Ethereum price seems to have taken a massive hit, indicating the start of a second leg.
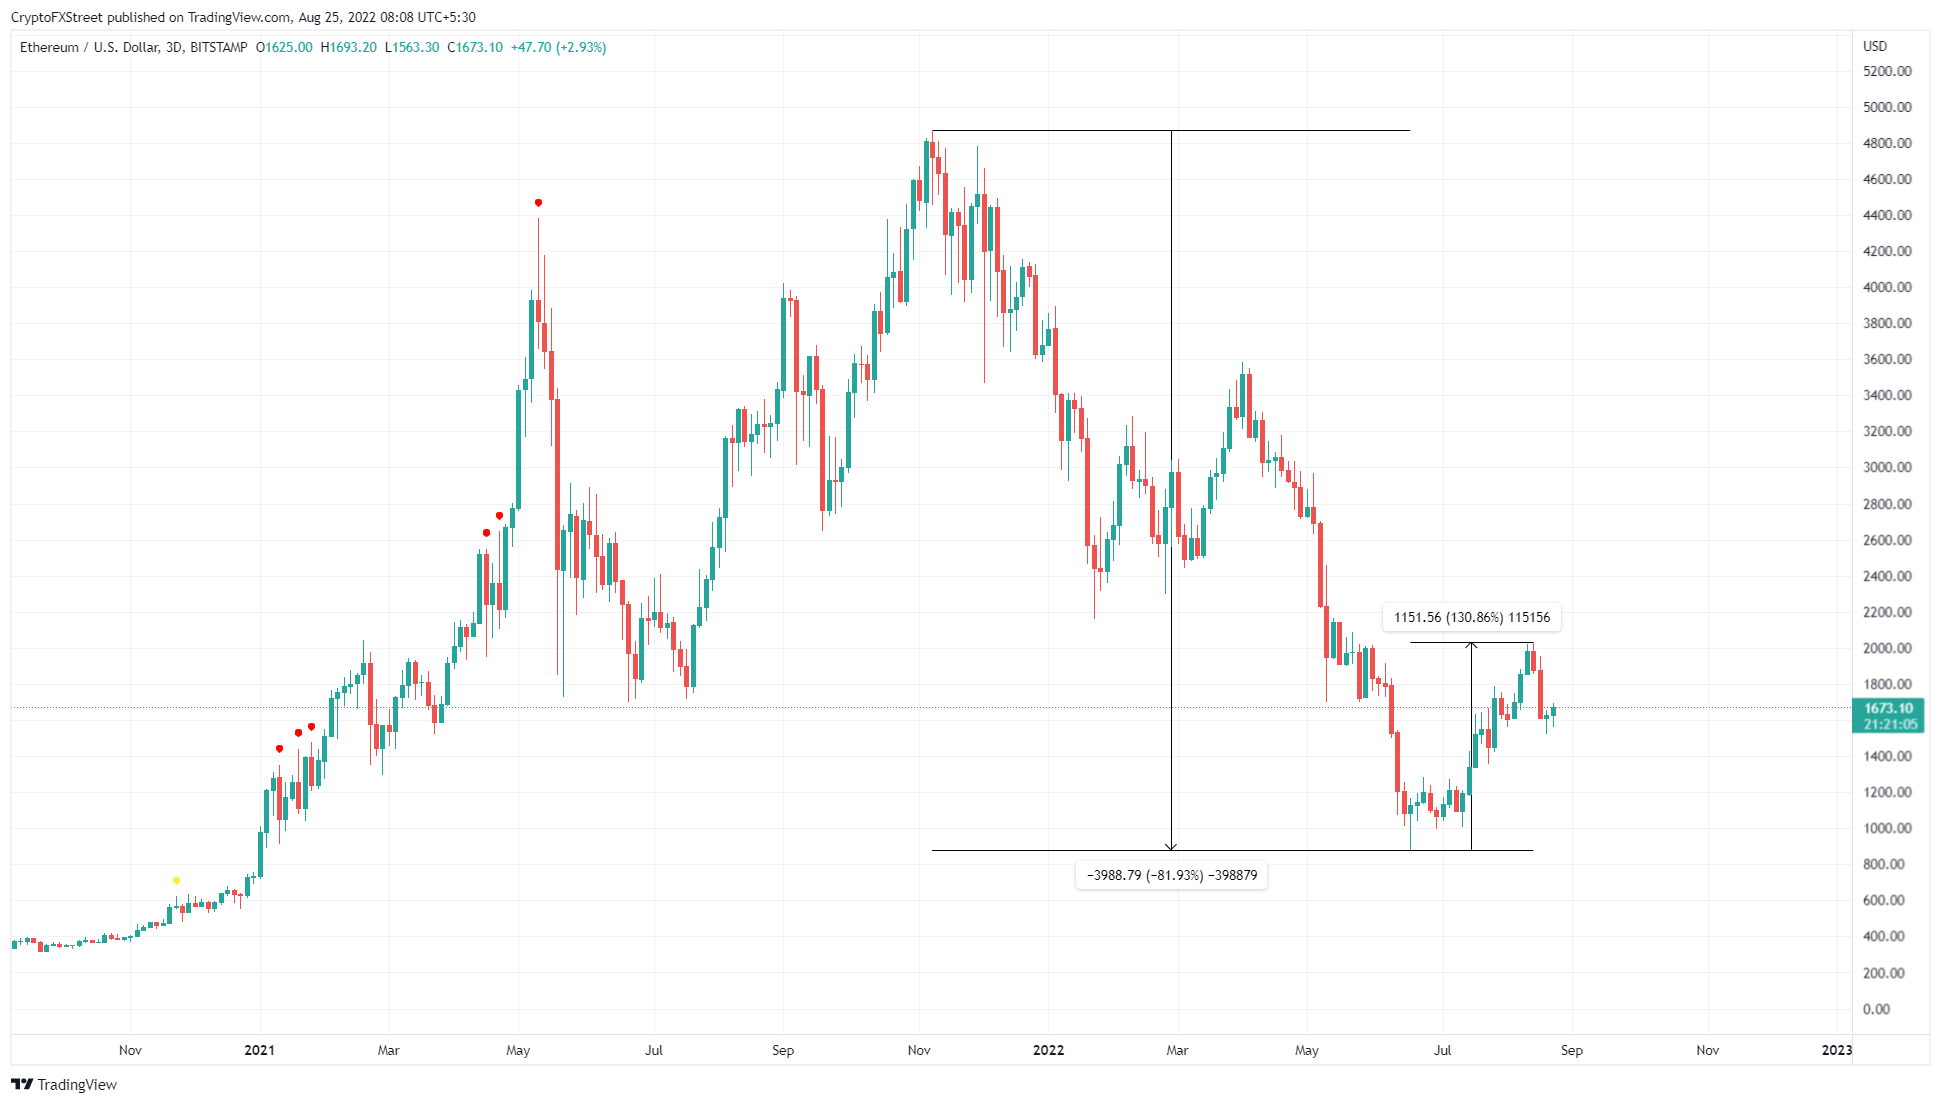
ETH/USD 3-day chart
On the 12-hour chart, Ethereum price reveals a shift in narrative from bullish to bearish as it dropped 25% between August 14 and August 20. This move created a lower low at $1,524 with respect to the August 10 swing low at $1,656.
This development shows that the bears are currently in control and the ongoing recovery bounce is just a failed bullish attempt. The logical step is preparing for the incoming downtrend and identifying a perfect entry to open short positions.
The fair value gap (FVG), aka price inefficiency, extending from $1,726 to $1,823, is the ideal zone for entry, but a close look reveals that $1,730 is a high time frame resistance level. This confluence makes $1,730 a perfect place to start accumulating short positions.
After a minor uptick to $1,730, market participants can expect a straight drop into the other imbalances aka FVGs at $1,471, $1,125 and the equal lows at $996. However, due to the presence of a stable support level at $1,280, market participants can expect Ethereum price to stop its downtrend here, making it a perfect place to cover the short positions.
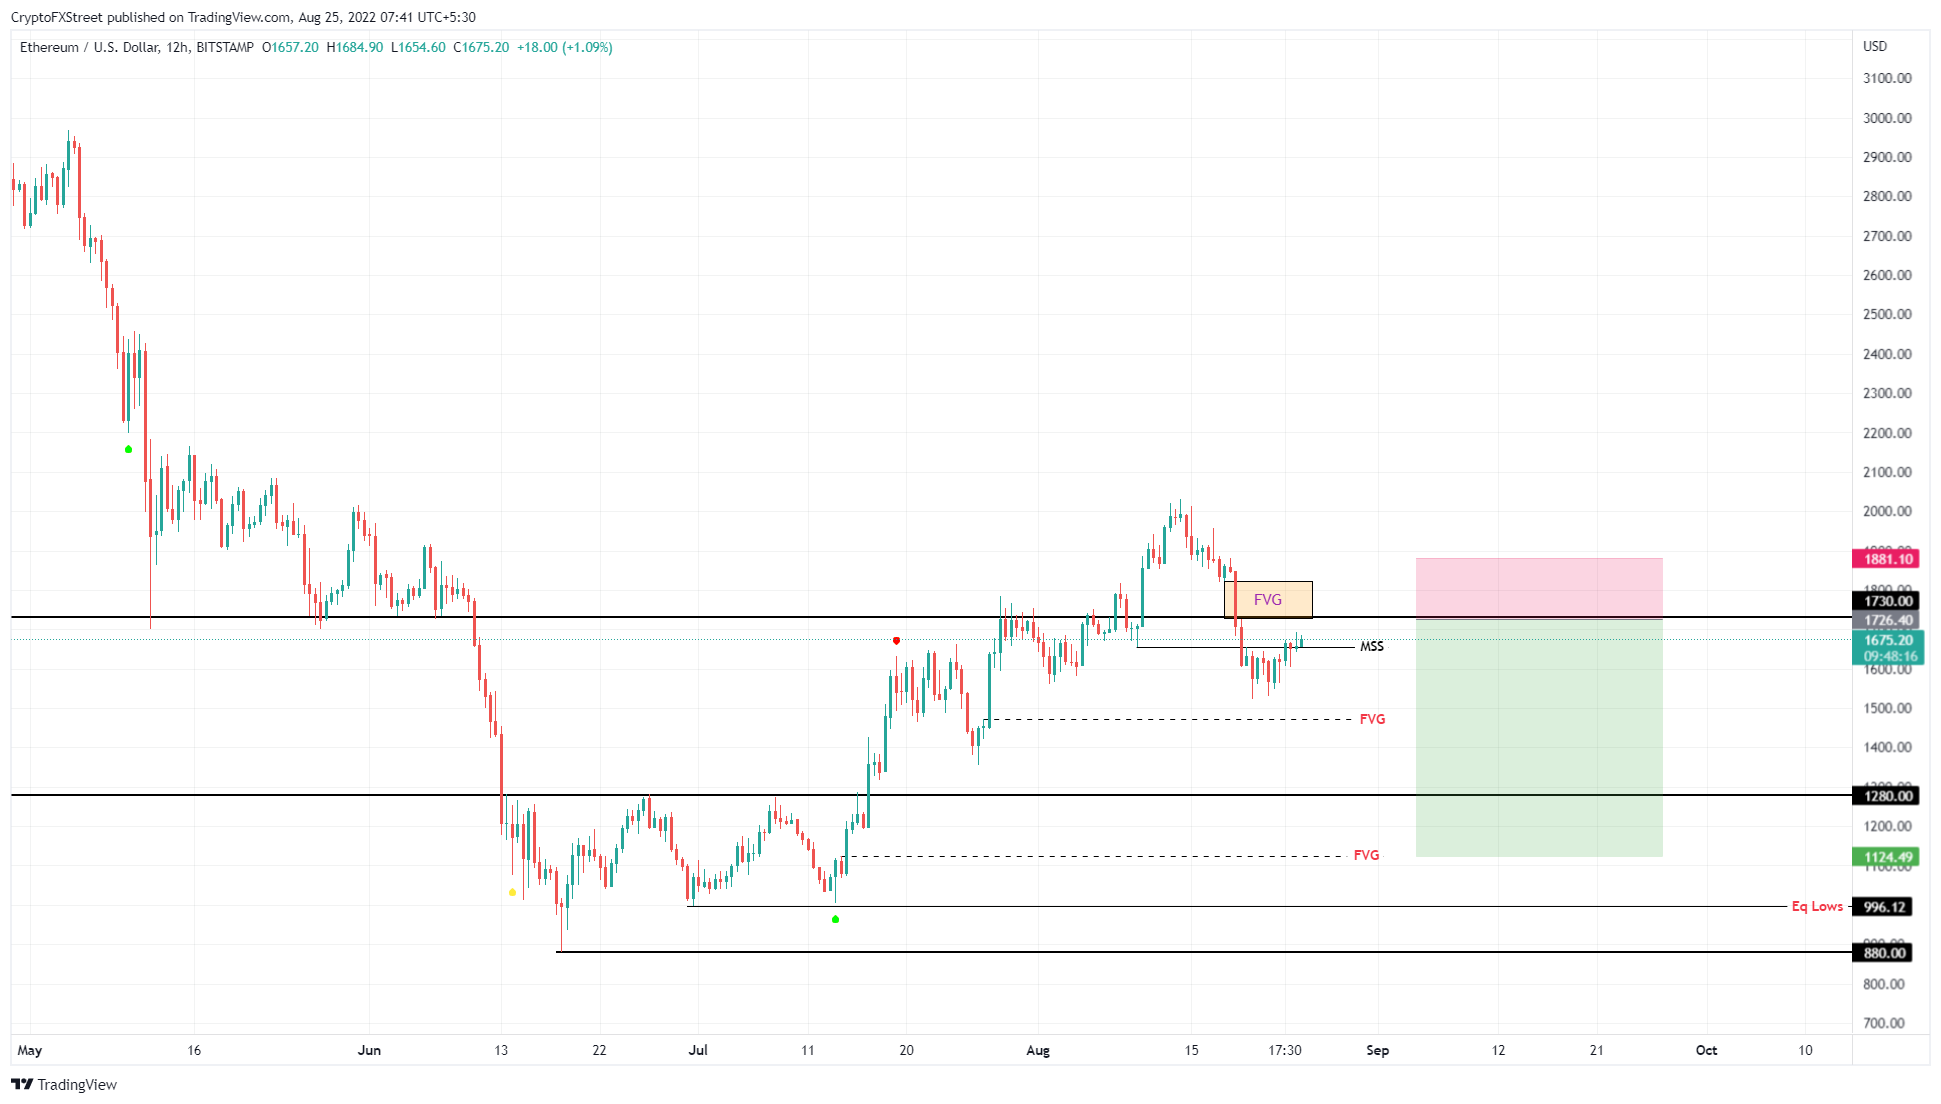
ETH/USDT 12-hour chart
Multiplying rewards with higher risk
However, a riskier play is to cover only 50% of the shorts and keep the rest to see if ETH can produce a lower low relative to the June 18 swing low at $880. If successful, this development will indicate that a steeper correction awaits the smart contract token.
In such a case, market participants can start re-accumulating short positions around the $1,000 psychological level, with the expectation of a potential crash to $600.
From a macro perspective, Ethereum price has created a volume gap, extending from $960 to $383. The volume profile also shows that $755 and $591 could help absorb the selling pressure and potentially allow a macro base formation here.
Therefore, the reaccumulated short positions at roughly $1,200 to $1,000 can be covered at $,600 for a hefty profit.
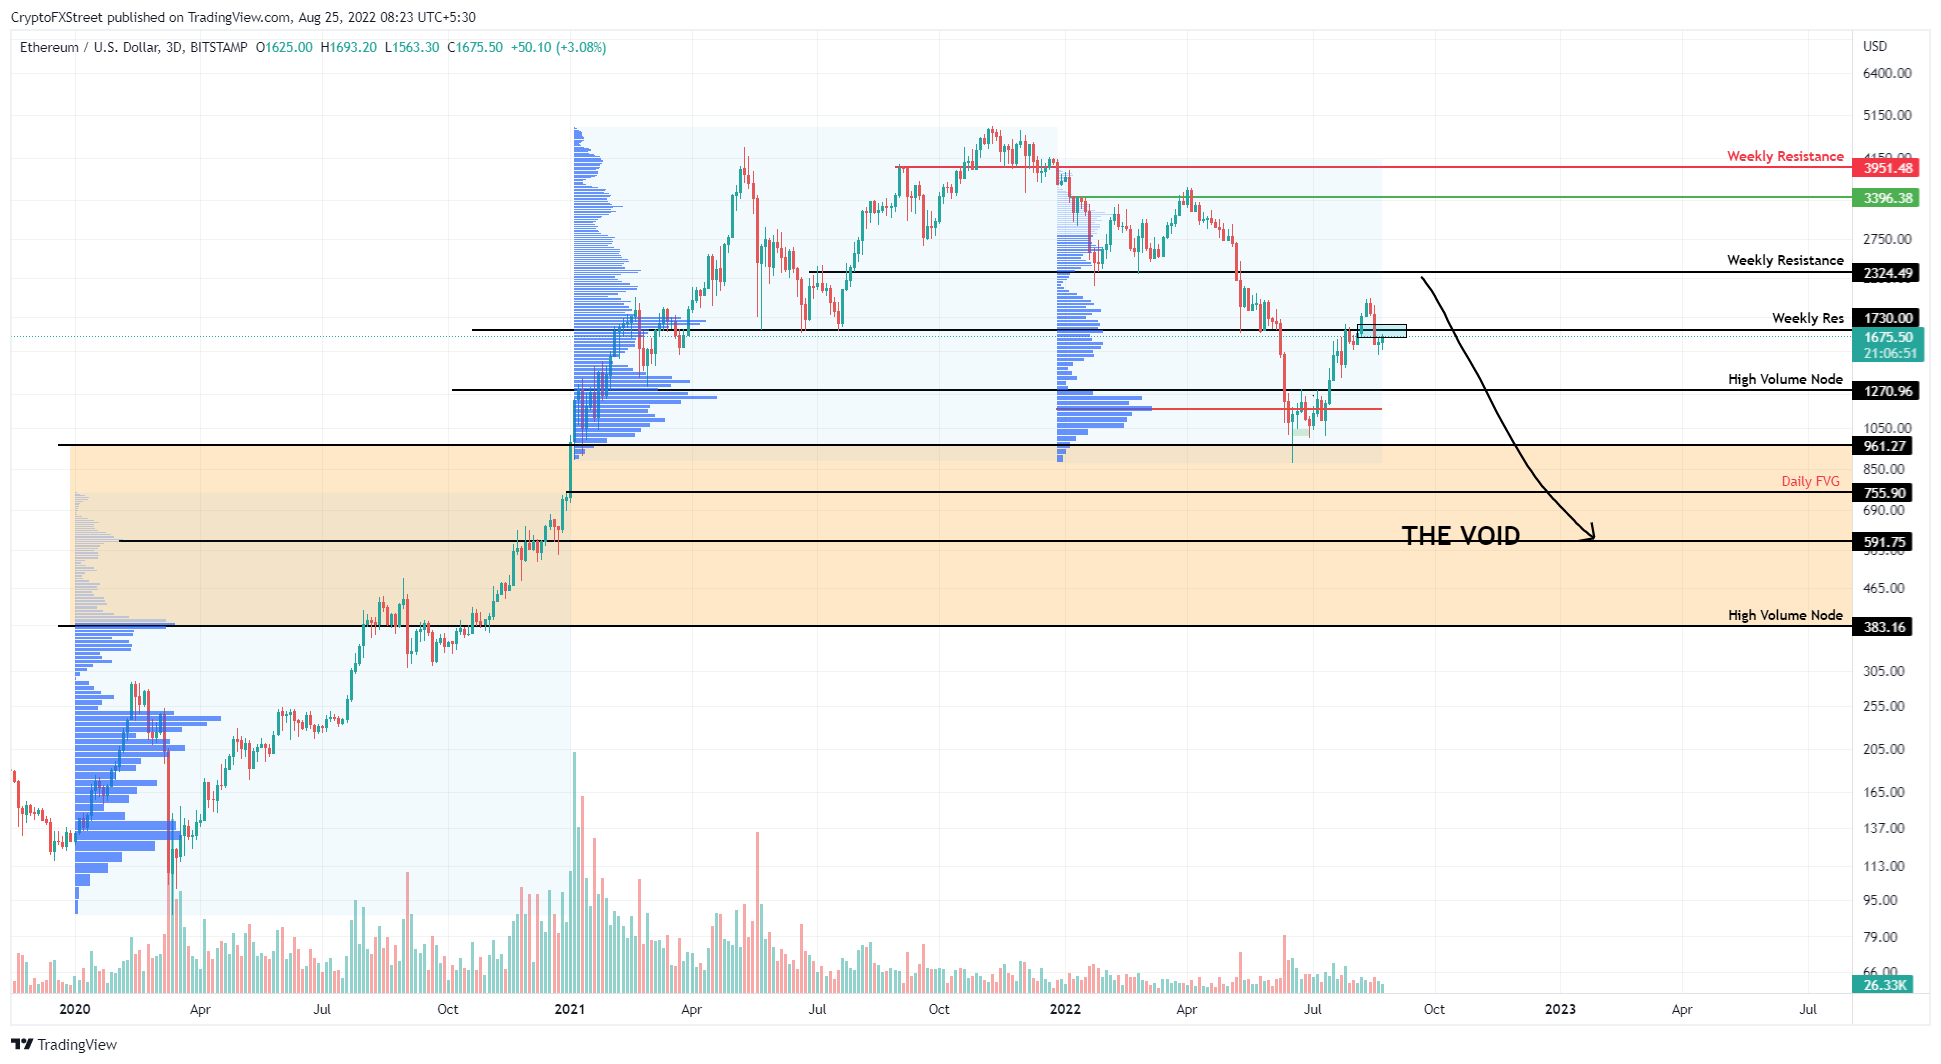
ETH/USD 3-day chart
While the above thesis makes sense from a logical standpoint, the Merge is an important event from a historical perspective, and this shift from PoW to PoS signifies an inherent change in the Ethereum blockchain like never before.
Therefore, despite the data supporting a sell-off, the hype could instead trigger a run-up. If this move produces a higher high above the August 18 swing high at $1,881, it will indicate the first chink in the bears’ armor.
However, a 12-hour candlestick close above $1,957 will create a higher high and invalidate the bearish thesis for Ethereum price.
Note
While the macro or high time frame outlook is bearish, the video attached below explains how to capitalize on the recovery rally taking place on a much lower time frame.
Author

Akash Girimath
FXStreet
Akash Girimath is a Mechanical Engineer interested in the chaos of the financial markets. Trying to make sense of this convoluted yet fascinating space, he switched his engineering job to become a crypto reporter and analyst.


