Hyperliquid Price Forecast: HYPE approaches $50 breakout on rising perpetual DEX volume
- Hyperliquid recovers to the $50.00 mark as bearish pressure eases across the crypto market.
- Hyperliquid perpetual DEX volume surges to $9.47 billion as risk-on sentiment improves.
- HYPE DeFi TVL increases 5% in the last 24 hours, signaling investors' confidence in the token and the ecosystem.

Hyperliquid (HYPE) offers bullish signals, approaching resistance at $50.00 on Thursday. The Decentralized Exchange (DEX) token has steadily recouped its September losses from the support level around $40.00, underpinned by improving sentiment in the broader cryptocurrency market.
Key milestones within the ecosystem also support HYPE's bullish outlook, particularly the launch of HUSD, the DEX platform's native stablecoin. Hyperliquid's Decentralized Finance (DeFi) ecosystem has also gained momentum following significant drawdowns in September, which has backed the bullish sentiment surrounding the Hyperliquid price.
DeFi development fuels Hyperliquid's bullish outlook
Hyperliquid perpetual DEX is seeing a resurgence in trading volume, as prices generally recover in the broader cryptocurrency market. DefiLlama data shows that the volume averages $9.47 billion, up from approximately $4 billion on Saturday. This increase indicates that engagement is improving, which in turn increases the demand for HYPE as traders cover transaction fees.
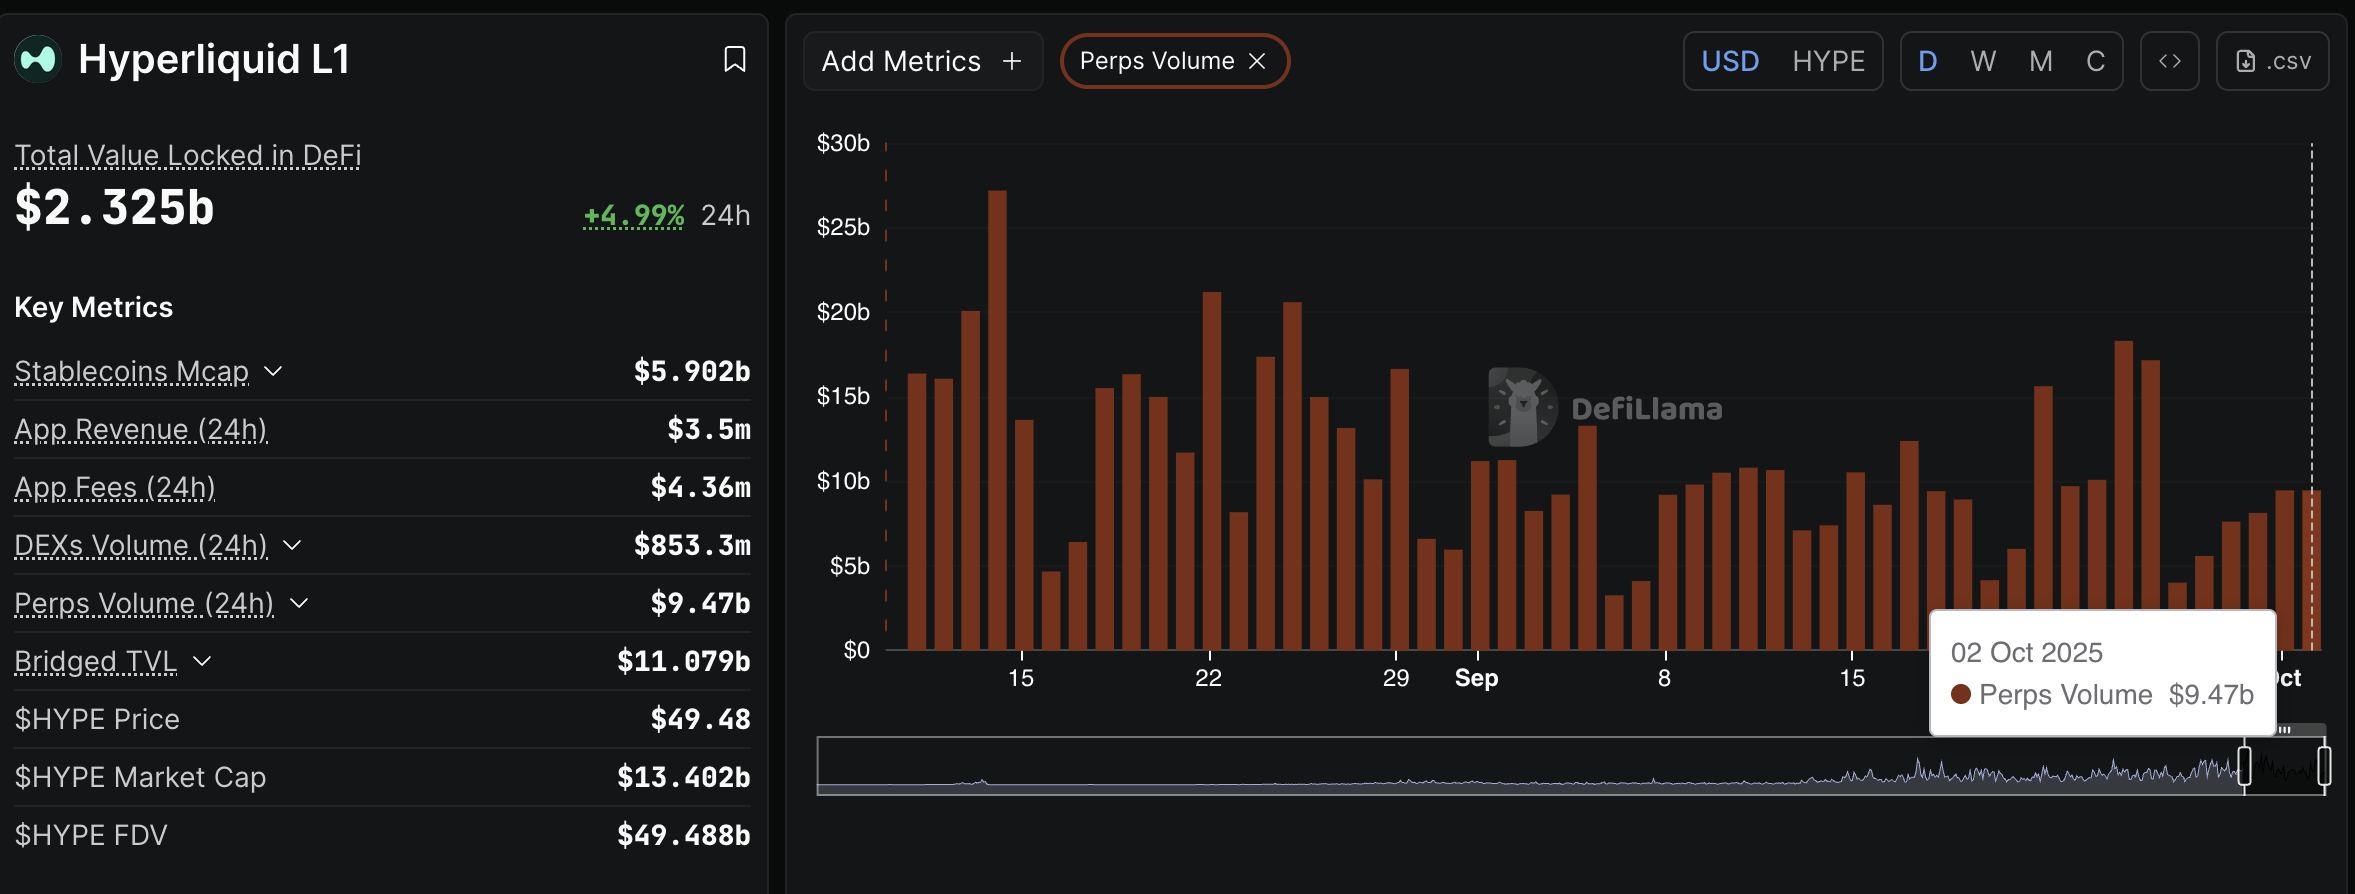
Hyperliquid perpetual DEX volume | DefiLlama
A subsequent growth in the DeFi Total Value Locked (TVL), which combines the value of all coins held in smart contracts on the platform, supports the bullish sentiment surrounding HYPE.
TVL currently stands at $2.35 billion, up 5% over the past 24 hours and 13% since Friday. Investors often transfer assets into smart contracts to participate in securing the network and earn rewards in return. This happens when they have confidence in the token and its ecosystem. Therefore, a persistent growth in the TVL would bolster Hyperliquid's bullish outlook amid easing selling pressure in the open market.
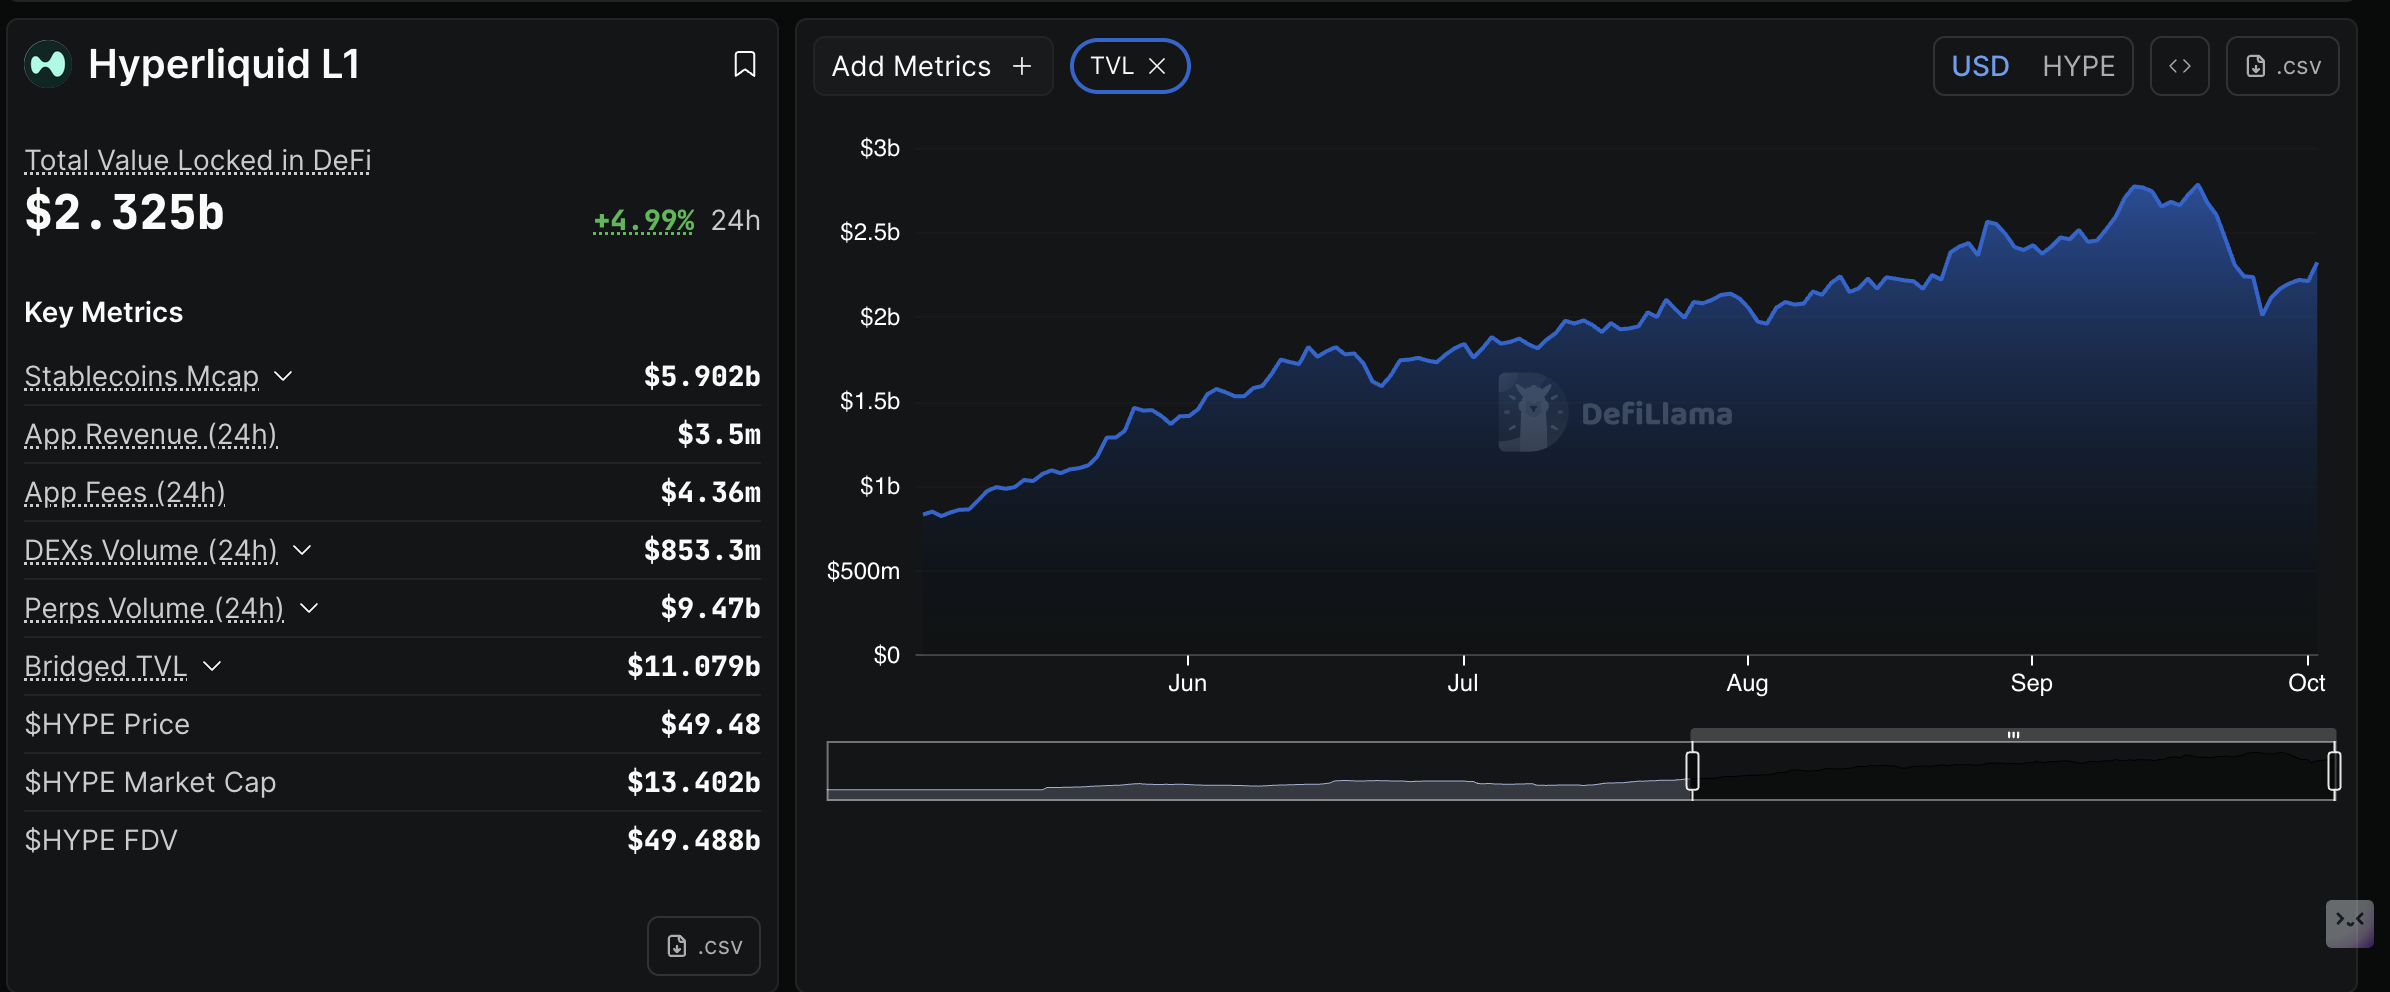
Hyperliquid DeFi TVL | Source: DefiLlama
Technical outlook: Hyperliquid eyes leg up above $50
Hyperliquid is on the verge of breaching resistance at $50.00, supported by positive sentiment surrounding the token and the broader crypto market. The Relative Strength Index (RSI), currently at 52 on the daily chart, is rising in tandem with the price, indicating that selling pressure is easing.
The Moving Average Convergence Divergence (MACD) indicator could validate a buy signal on the same daily chart if the blue line crosses and settles above the red signal line. Traders will continue seeking risk exposure as the MACD rises above the red signal line and the green histogram bars expand.
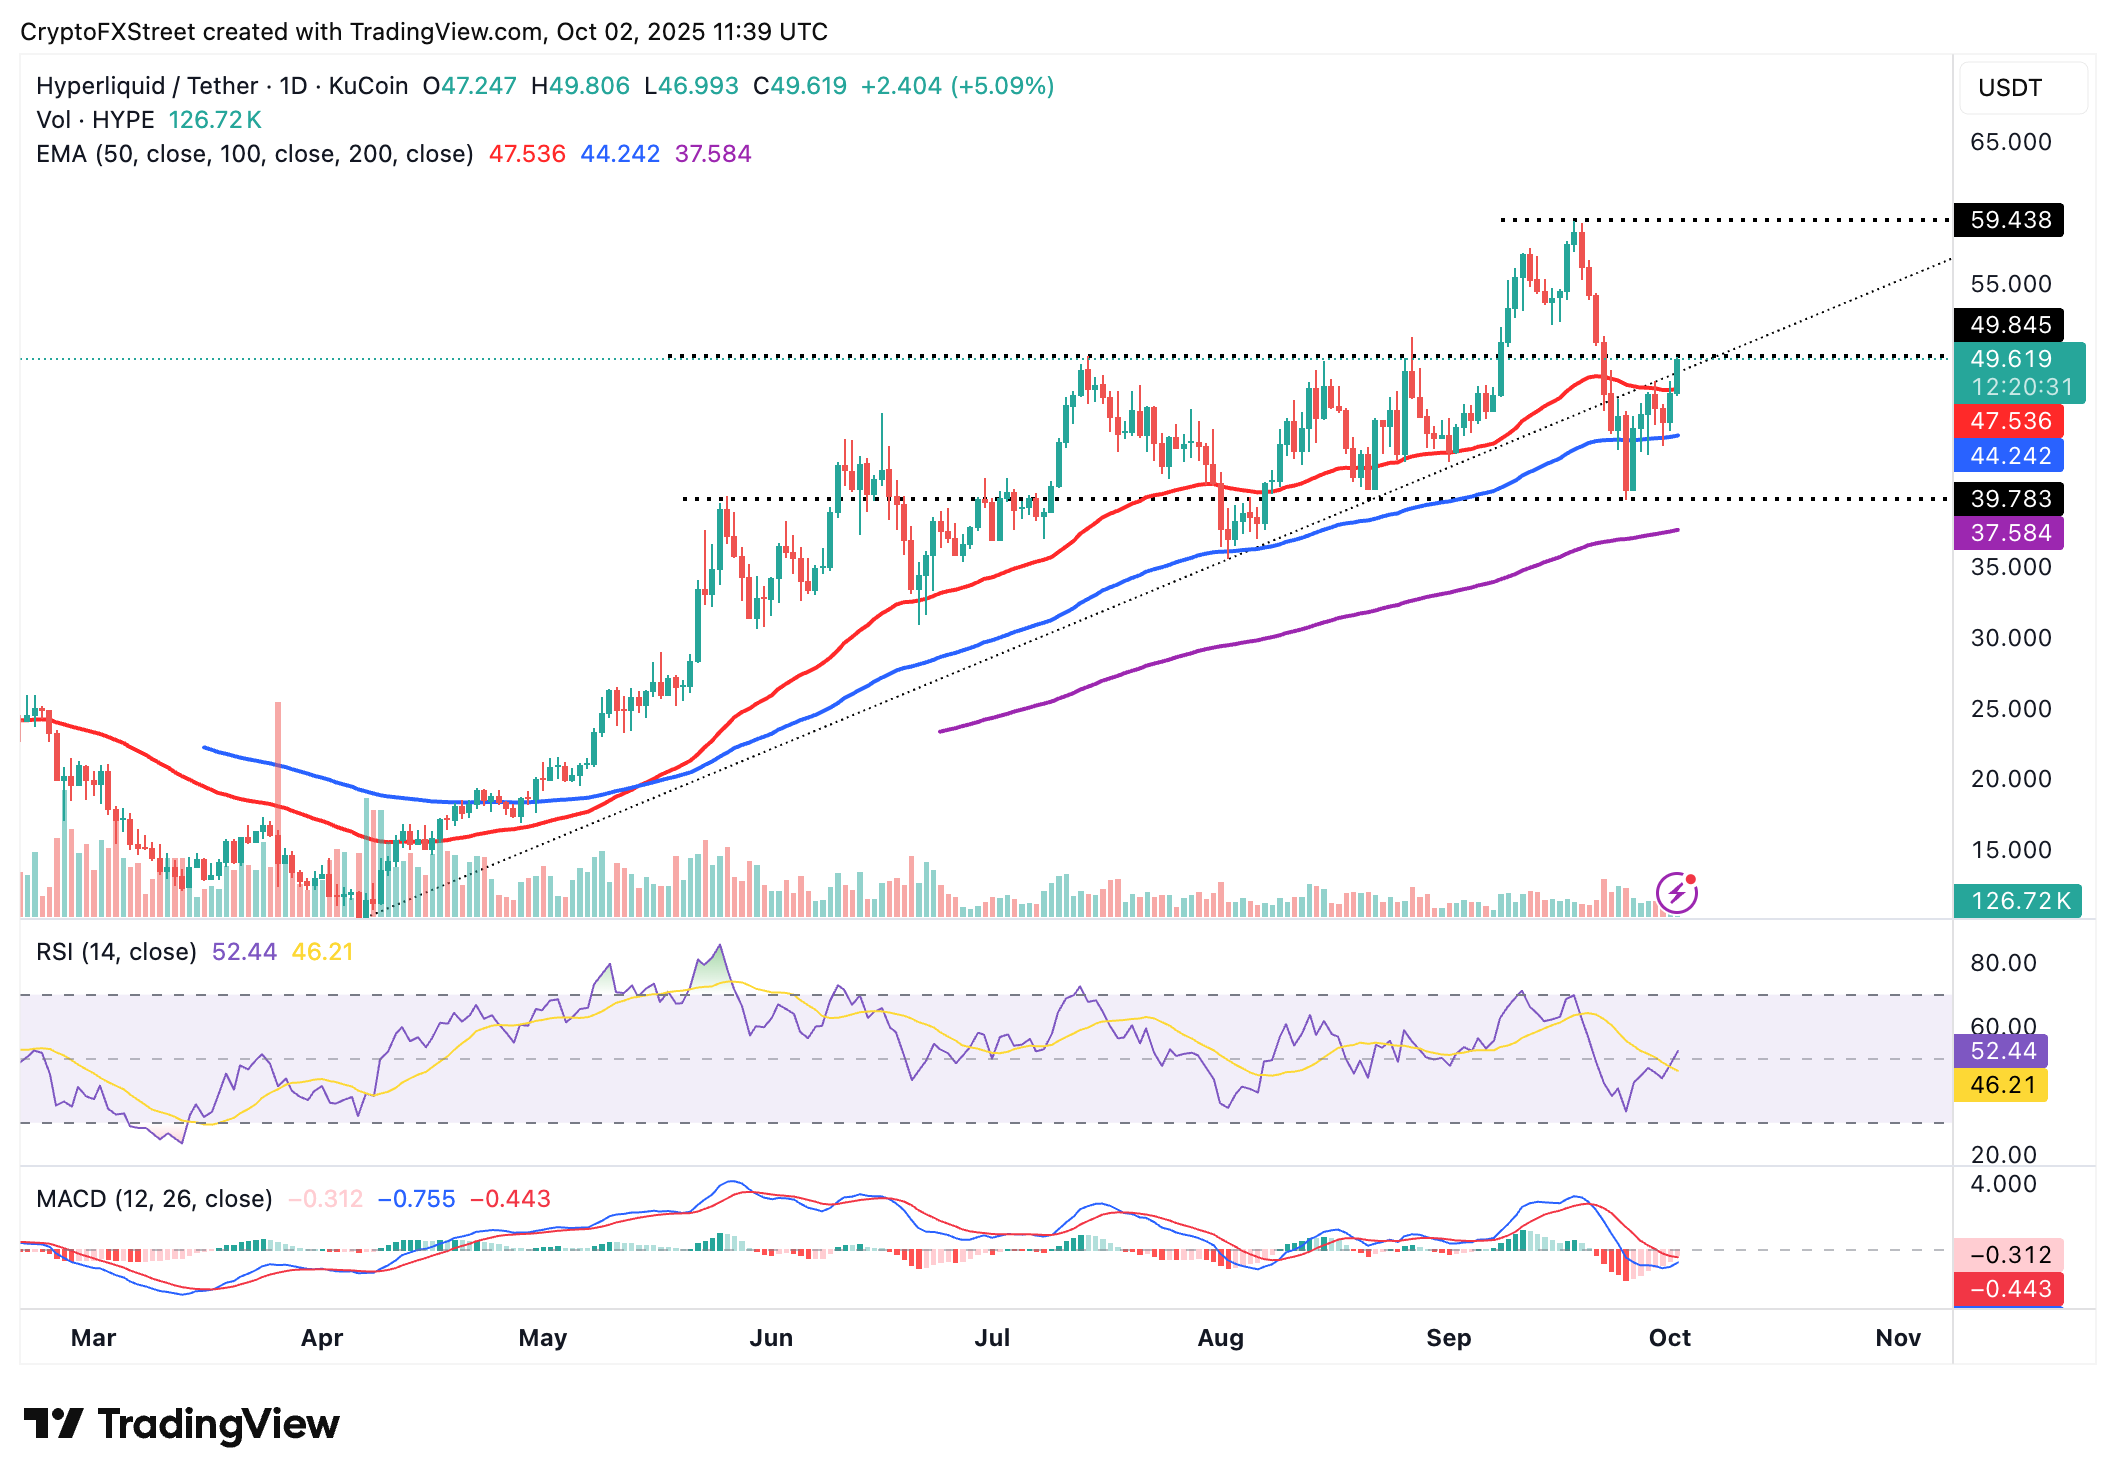
HYPE/USDT daily chart
Key milestones for Hyperliquid include a daily close above the $50.00 mark, which would mark a higher support ahead of the next leg up toward its record high of $59.43, reached on September 18.
Still, if profit-taking causes a sudden decline, Hyperliquid could find support at the 50-day Exponential Moving Average (EMA) at $47.53, with the 100-day EMA providing additional support at $44.24.
Cryptocurrency metrics FAQs
The developer or creator of each cryptocurrency decides on the total number of tokens that can be minted or issued. Only a certain number of these assets can be minted by mining, staking or other mechanisms. This is defined by the algorithm of the underlying blockchain technology. On the other hand, circulating supply can also be decreased via actions such as burning tokens, or mistakenly sending assets to addresses of other incompatible blockchains.
Market capitalization is the result of multiplying the circulating supply of a certain asset by the asset’s current market value.
Trading volume refers to the total number of tokens for a specific asset that has been transacted or exchanged between buyers and sellers within set trading hours, for example, 24 hours. It is used to gauge market sentiment, this metric combines all volumes on centralized exchanges and decentralized exchanges. Increasing trading volume often denotes the demand for a certain asset as more people are buying and selling the cryptocurrency.
Funding rates are a concept designed to encourage traders to take positions and ensure perpetual contract prices match spot markets. It defines a mechanism by exchanges to ensure that future prices and index prices periodic payments regularly converge. When the funding rate is positive, the price of the perpetual contract is higher than the mark price. This means traders who are bullish and have opened long positions pay traders who are in short positions. On the other hand, a negative funding rate means perpetual prices are below the mark price, and hence traders with short positions pay traders who have opened long positions.
Author

John Isige
FXStreet
John Isige is a seasoned cryptocurrency journalist and markets analyst committed to delivering high-quality, actionable insights tailored to traders, investors, and crypto enthusiasts. He enjoys deep dives into emerging Web3 tren



