Hedera Price Prediction: Nasdaq filing to list Grayscale’s HBAR ETF could spark another 30% rally
- Hedera (HBAR) price rose 12% to hit $0.24 on Wednesday after Nasdaq filed to list Grayscale’s spot HBAR ETF.
- Hedera has averaged 1 billion HBAR in trading volume in each of the last three days, signaling heightened market interest.
- A double-bottom pattern appears on the HBAR 12-hourly chart, highlighting $0.32 as the next price target.

Hedera (HBAR) price rose 20% to hit $0.24 on Wednesday after Nasdaq filed to list Grayscale’s spot HBAR ETF. With market volumes elevated, bull traders could capitalize on positive market sentiment to advance the HBAR rally.
Hedera (HBAR) among top gainers as Nasdaq’s ETF filing sparks demand
Hedera (HBAR) has emerged as one of the standout altcoins since the start of the year, outperforming rival Layer-1 assets recently added to the U.S. Crypto Strategic Reserve.
This week, HBAR’s price rally has been fueled by positive developments surrounding ETF filings. On Wednesday, Nasdaq, one of the world's largest regulated trading platforms, submitted documentation to list Grayscale’s spot HBAR ETF for trading, pending approval from the U.S. Securities and Exchange Commission (SEC).
Many traders see this as a strong signal that an official ETF approval could be imminent.
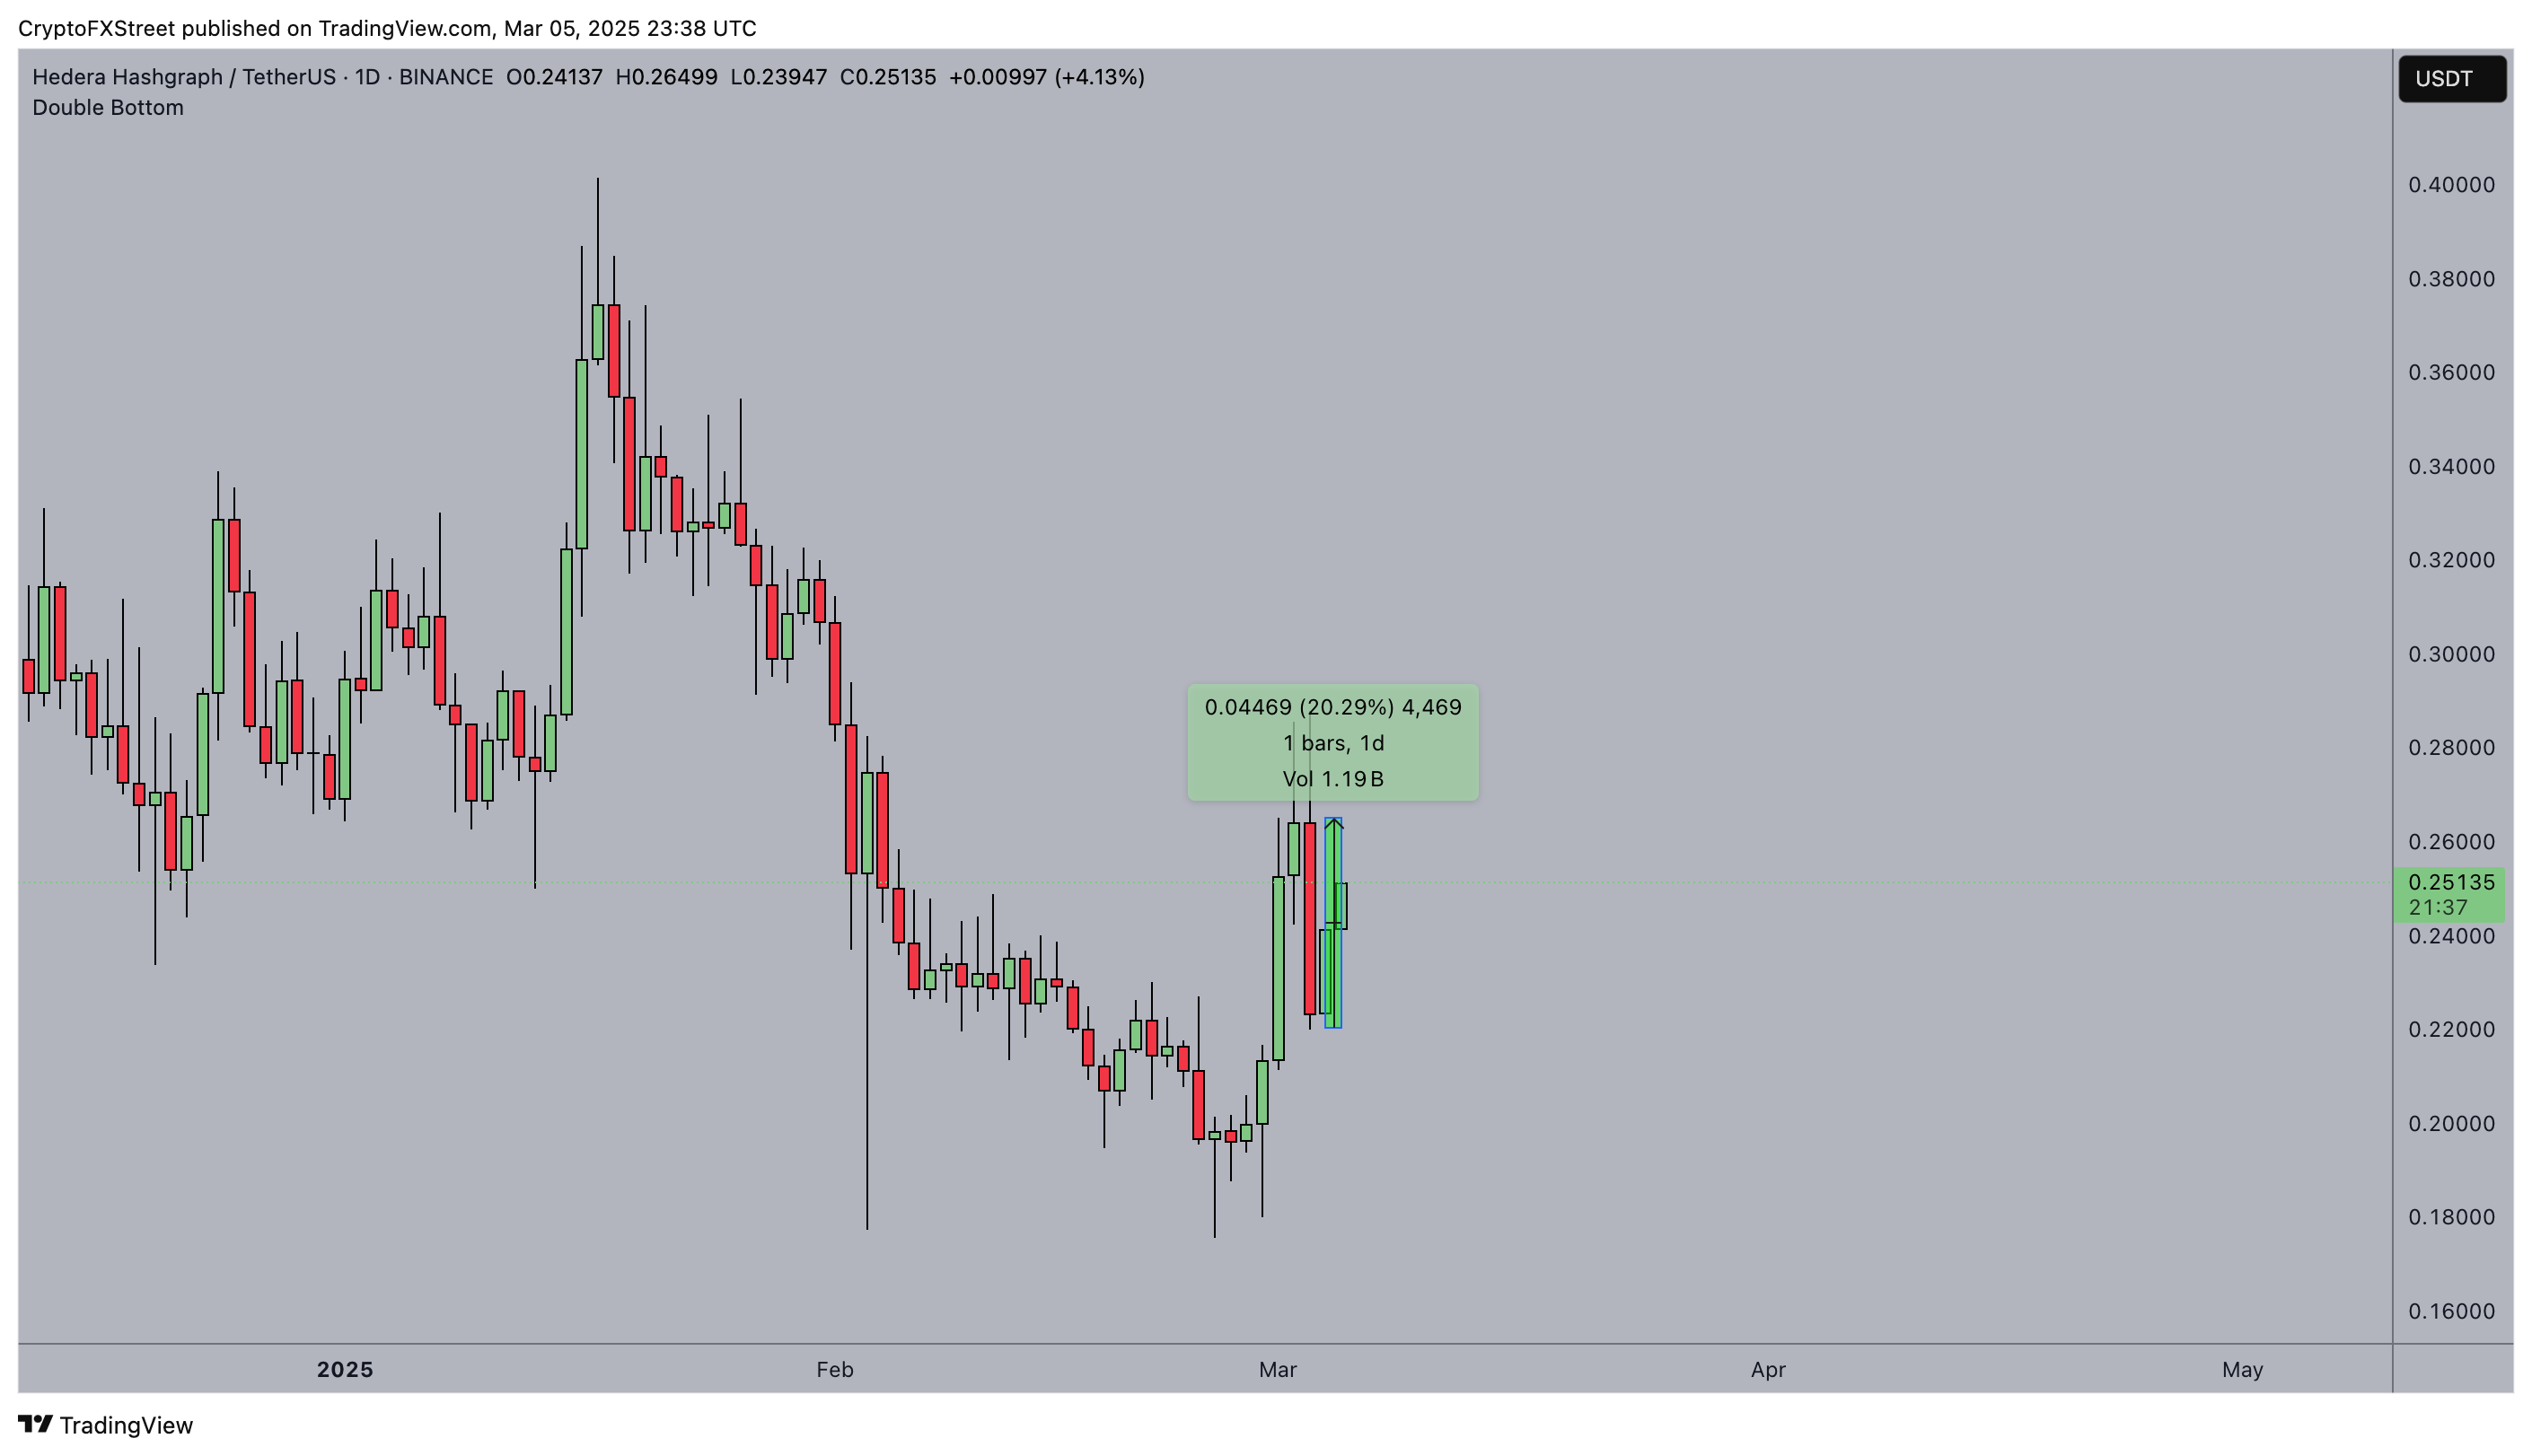
Hedera (HBAR) Price Action | March 5
In response, HBAR’s price has been on a steady upward trajectory, as strategic investors rushed to accumulate positions ahead of a potential SEC green light.
Approval would allow institutional investors to enter the spot HBAR market under a regulated framework, further bolstering demand.
As depicted above, Hedera’s native token surged from its Tuesday opening price of $0.22 to reclaim territory above $0.27 on Wednesday, reinforcing the growing bullish sentiment surrounding its ETF prospects.
Hedera’s rising trading volume signals strong buyer support
HBAR price has climbed 20% since Nasdaq’s announcement. However, speculation that former President Donald Trump could ease tariffs on Canada and Mexico has further lifted market sentiment. This dual catalyst has boosted investor activity on the Hedera network, a move that could trigger further gains.
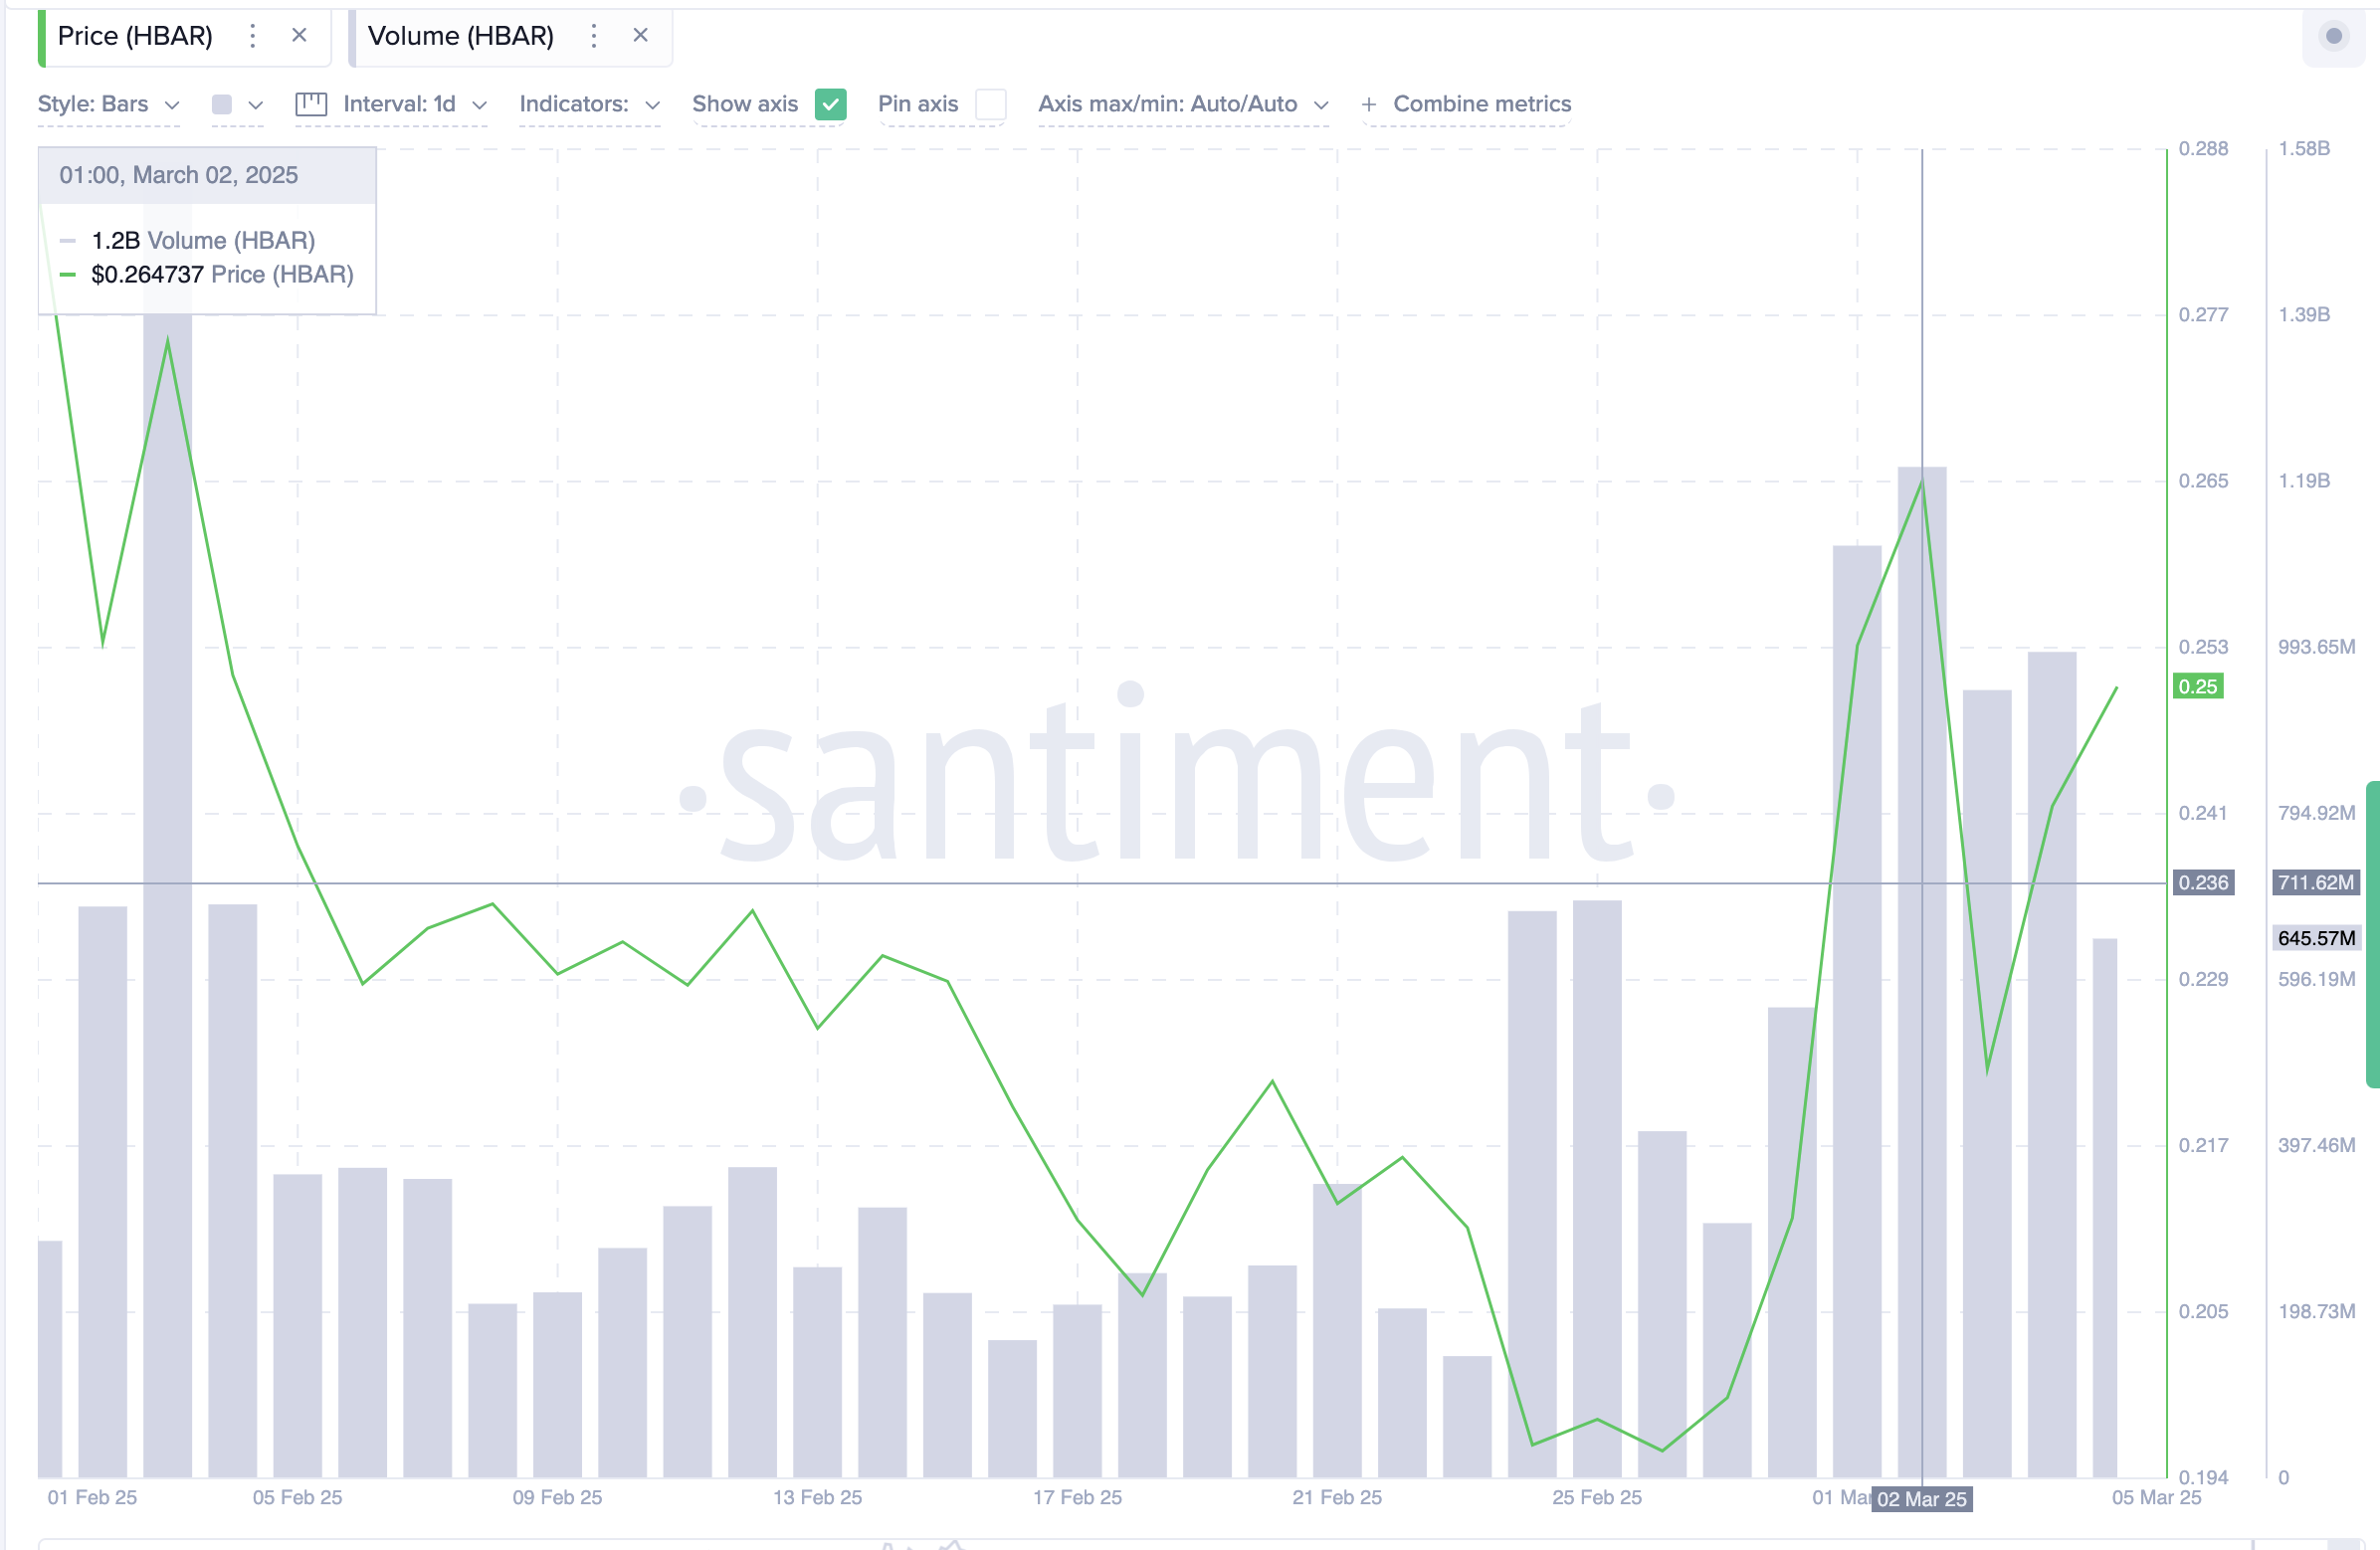
Hedera (HBAR) Trading Volume | Source: Santiment
Validating this stance, on-chain data from Santiment shows that HBAR has maintained an average daily trading volume of 1 billion HBAR over the past three days.
For context, this marks an 800% surge from the recent low of 143 million HBAR traded on February 23, when the market reacted to the fallout from Bybit’s $1.4 billion exploit.
Historically, a sustained spike in trading volume often precedes strong price rallies, as it indicates growing market participation and rising liquidity.
Increased volume reflects heightened investor confidence, reducing slippage when profit takers exit, which strengthens price stability at key support levels.
HBAR price forecast: Double-bottom pattern hints at rally to $0.32
HBAR’s recent breakout from a double-bottom formation suggests that bullish momentum is gaining traction, potentially driving another 30% rally towards $0.32.
The 12-hour chart confirms the pattern, with the HBAR price rebounding from the $0.17 support zone and surging past key resistance levels above $0.25 at press time.
Trading volume remains elevated at 1.03 billion HBAR, reinforcing strong investor interest and validating the uptrend.
The Bollinger Bands indicate expanding volatility, with HBAR currently testing the midline, signaling potential continuation if it holds above $0.22.
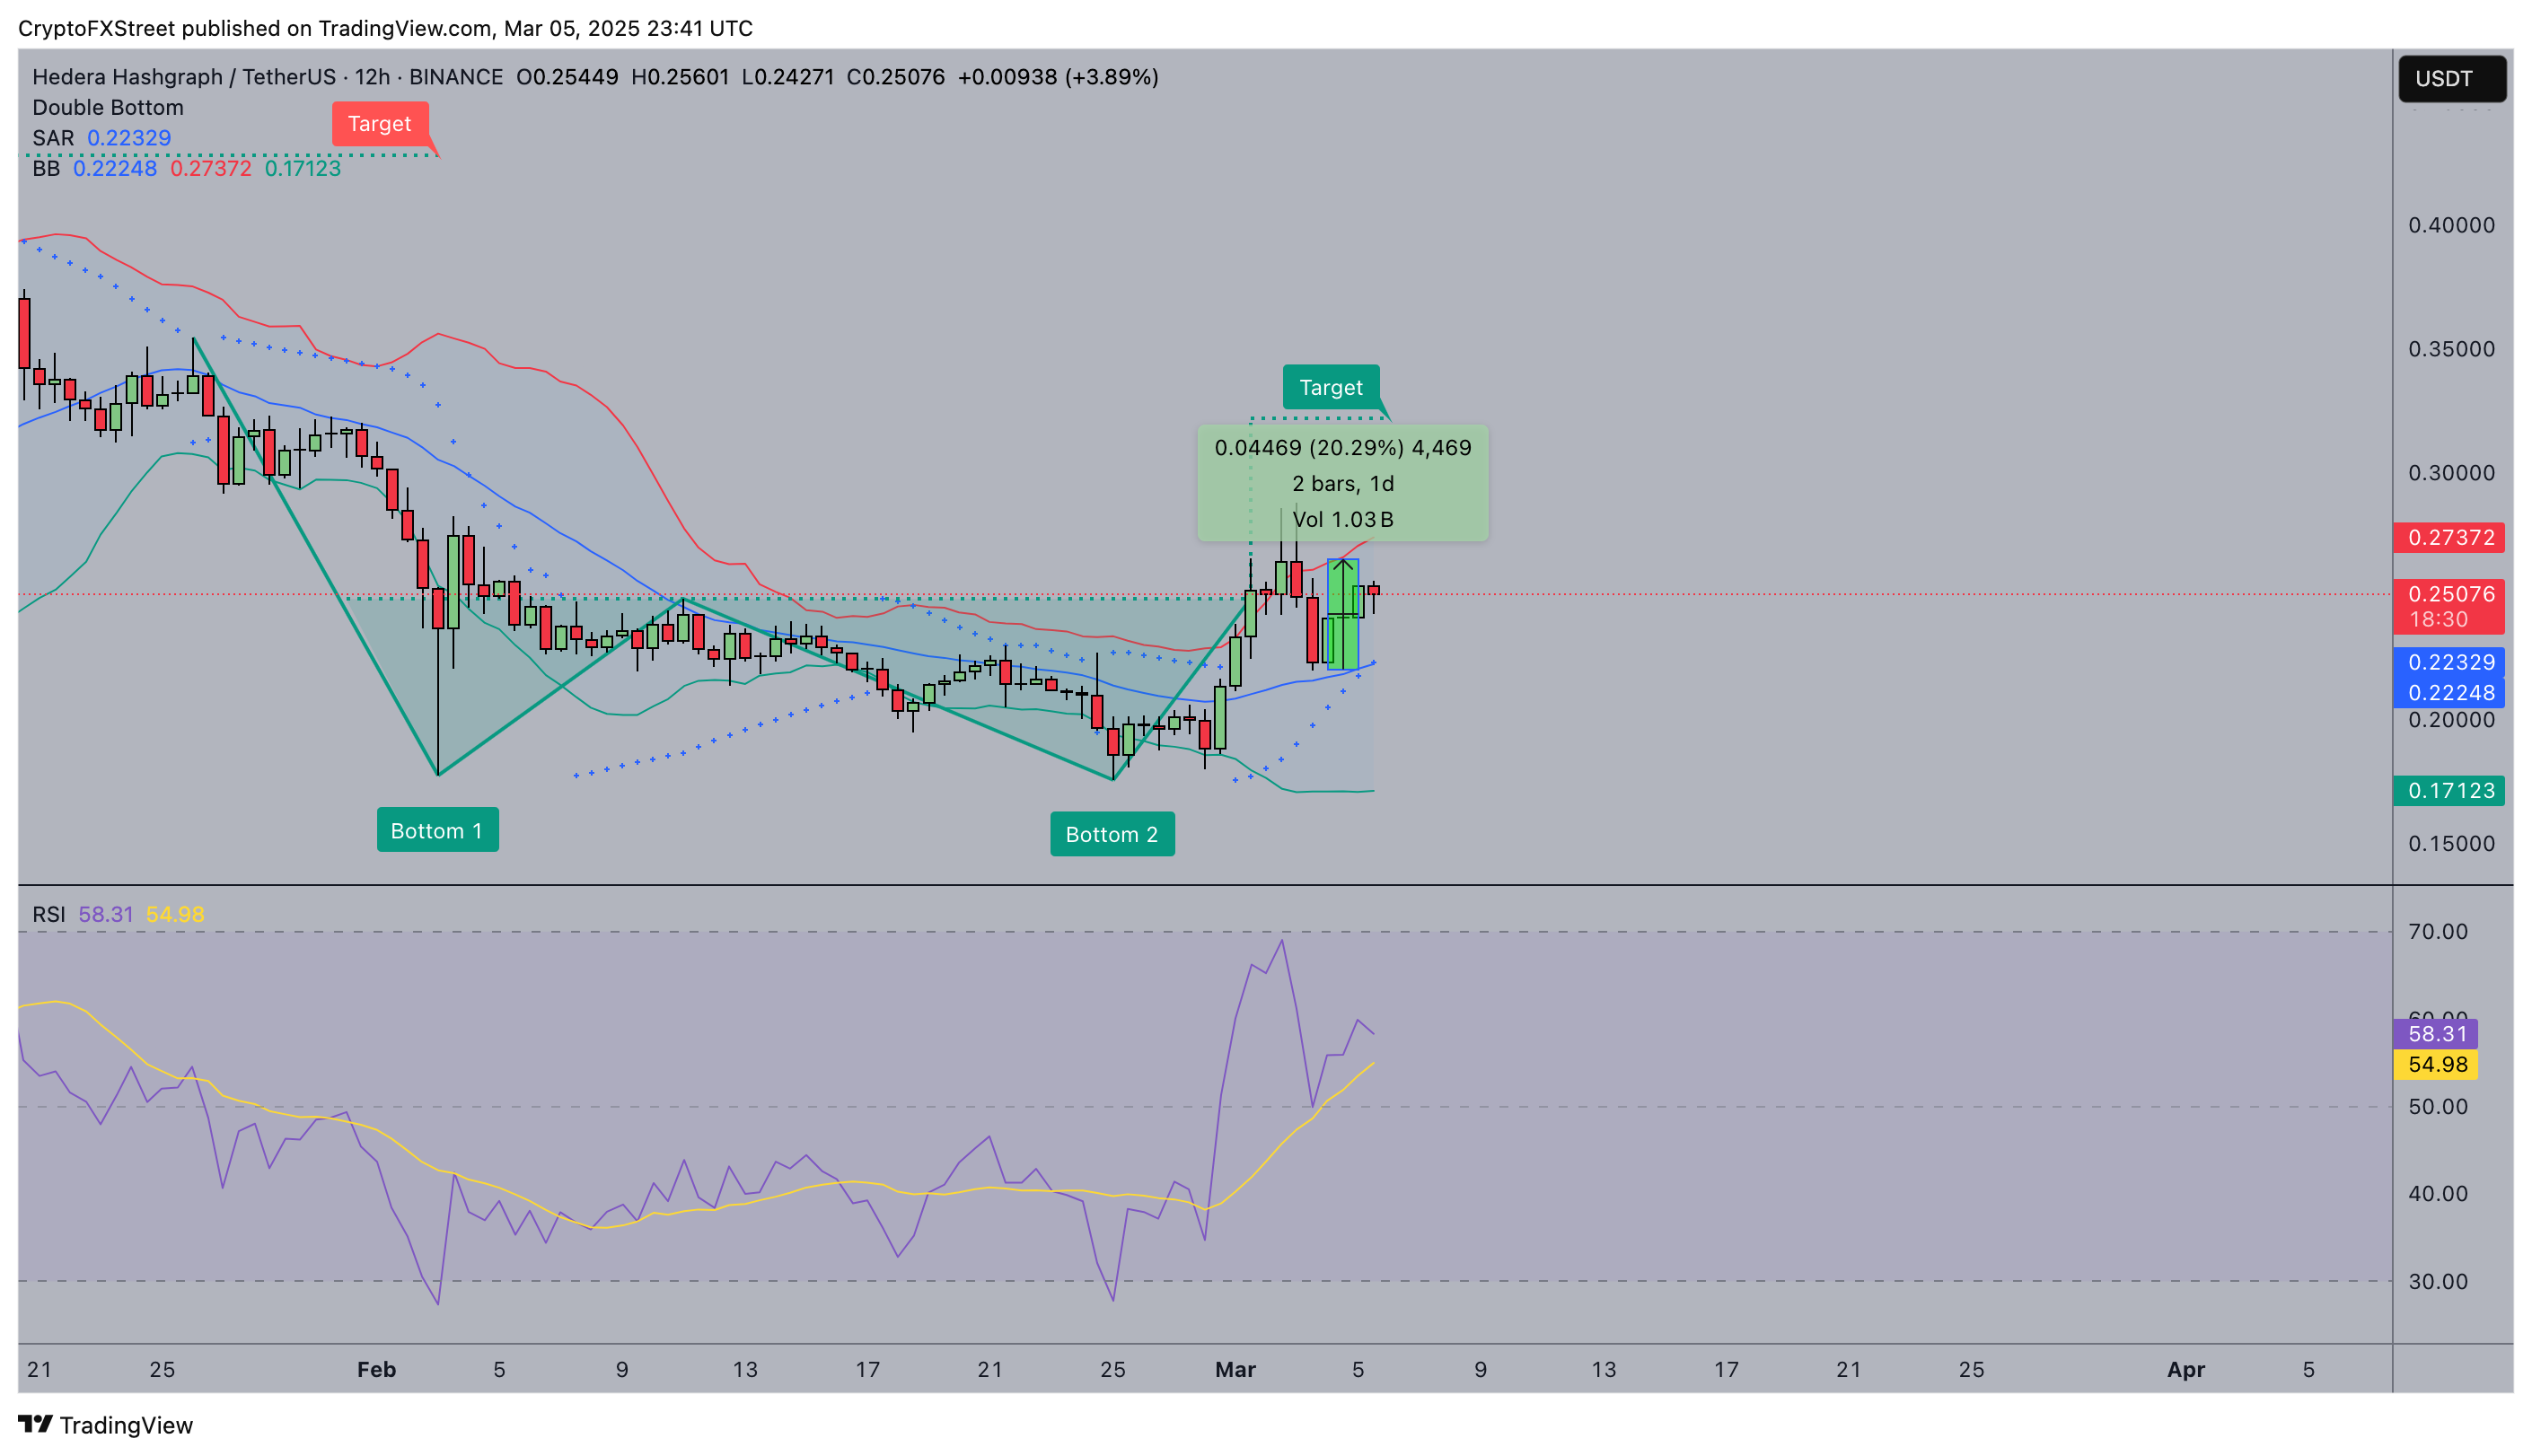
HBAR price forecast
The Relative Strength Index (RSI) at 58.59 shows room for further growth before entering overbought conditions, suggesting additional upside potential.
The Parabolic SAR dots below the price action confirm the prevailing uptrend, supporting a bullish scenario.
If HBAR maintains support at $0.22 and breaks the $0.27 resistance, it could trigger a rally toward the projected $0.32 target.
Conversely, failure to hold above $0.22 may expose HBAR to a retracement, with downside risks increasing if RSI trends lower and trading volumes decline.
A close below $0.20 could invalidate the bullish structure, shifting momentum toward bears.
However, given the prevailing technical setup and strong market participation, HBAR remains well-positioned for further gains in the near term.
Author

Ibrahim Ajibade
FXStreet
Ibrahim Ajibade is an accomplished Crypto markets Reporter who began his career in commercial banking. He holds a BSc, Economics, from University of Ibadan.


