Hedera Price Forecast: HBAR bulls remain optimistic as crucial support holds
- Hedera bounces off a crucial support level, which has been a consistent launchpad since July 16.
- HBAR Open Interest slips under $400 million as overhead pressure holds.
- The bullish bets indicate a recovery over the last 24 hours following the pullback from Monday.

Hedera (HBAR) ticks higher by nearly 2% at press time on Tuesday, after three consecutive bearish candles. HBAR recovers on the day from a crucial support level, fueling the bullish bets against the declining Open Interest backdrop. Still, the technical outlook remains mixed, suggesting further consolidation.
Hedera derivatives flash mixed signals
CoinGlass data shows Hedera’s Open Interest (OI) declined below the $400 million mark to $391.83 million on Tuesday, down from $409.16 million on Monday. The drop in OI relates to increased capital outflow from HBAR derivatives due to increased liquidation.
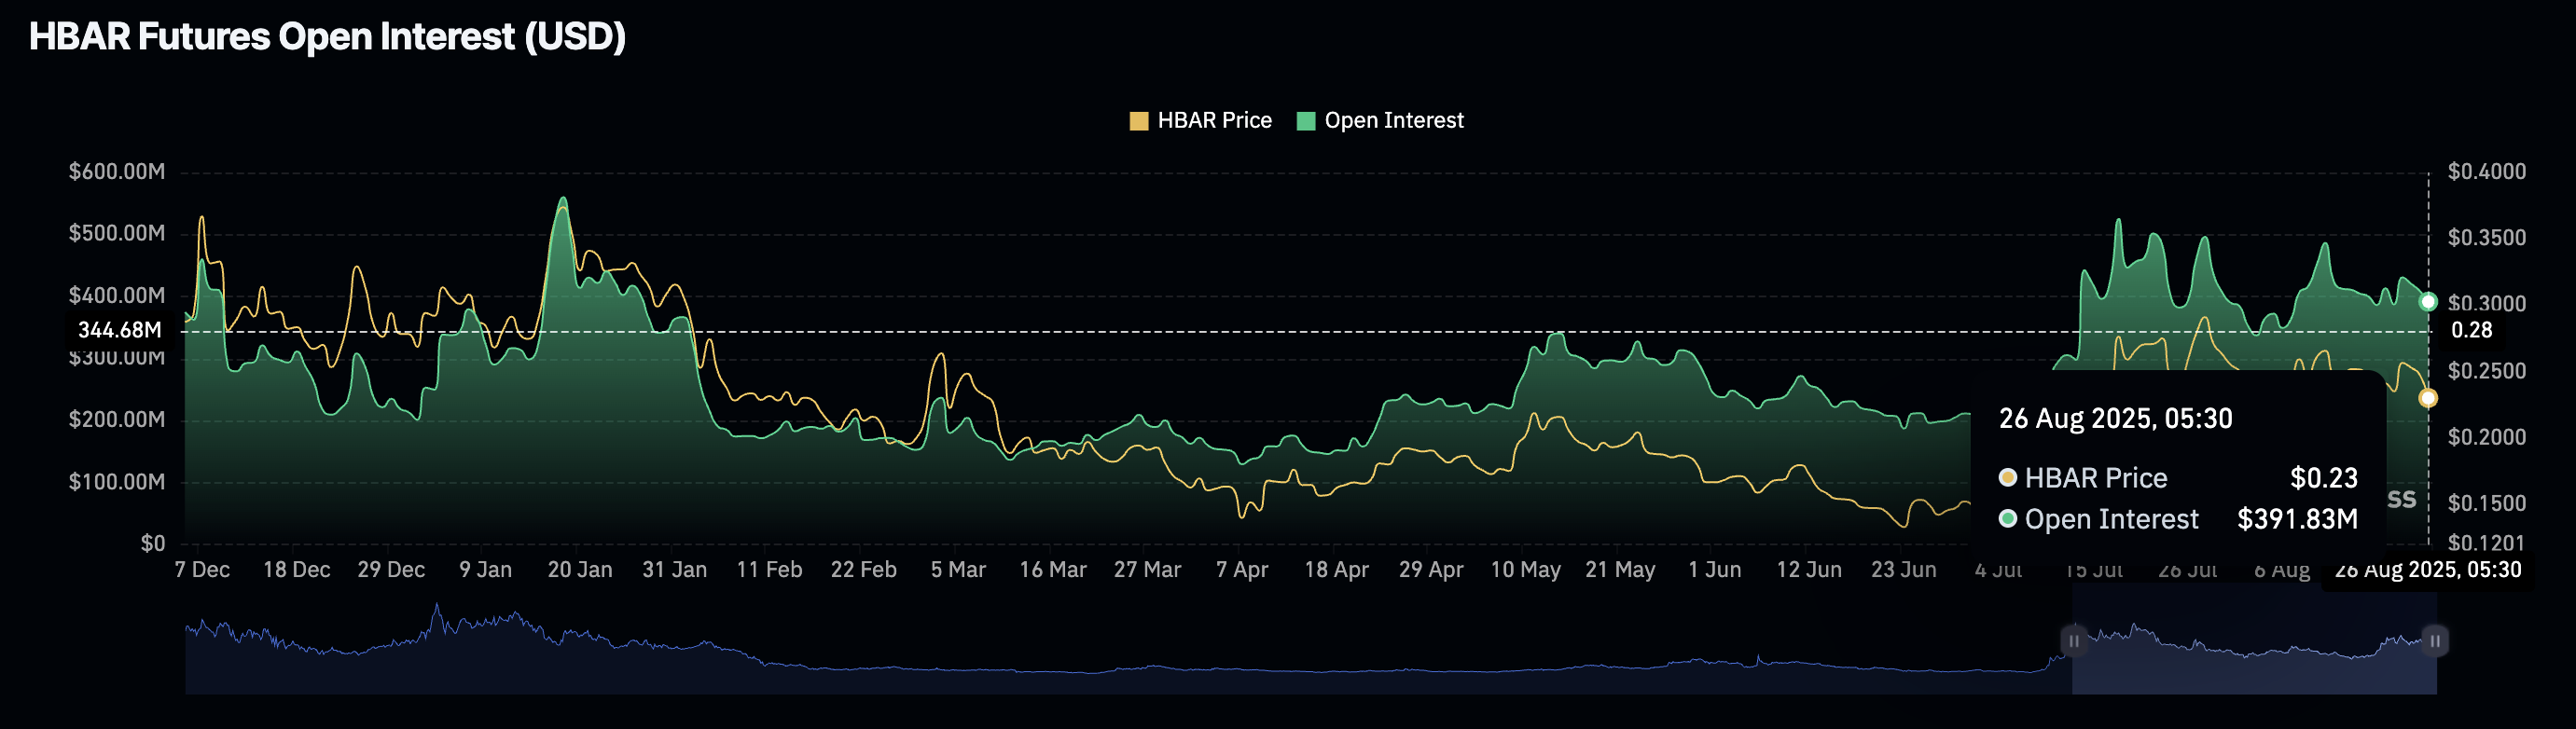
HBAR Open Interest. Source: Coinglass
Despite the outflow, optimism among investors is gradually increasing, as the Taker buy jumps to 48.55% from 47.63% on Monday. The long-to-short ratio has increased to 0.9436 during the same time period.
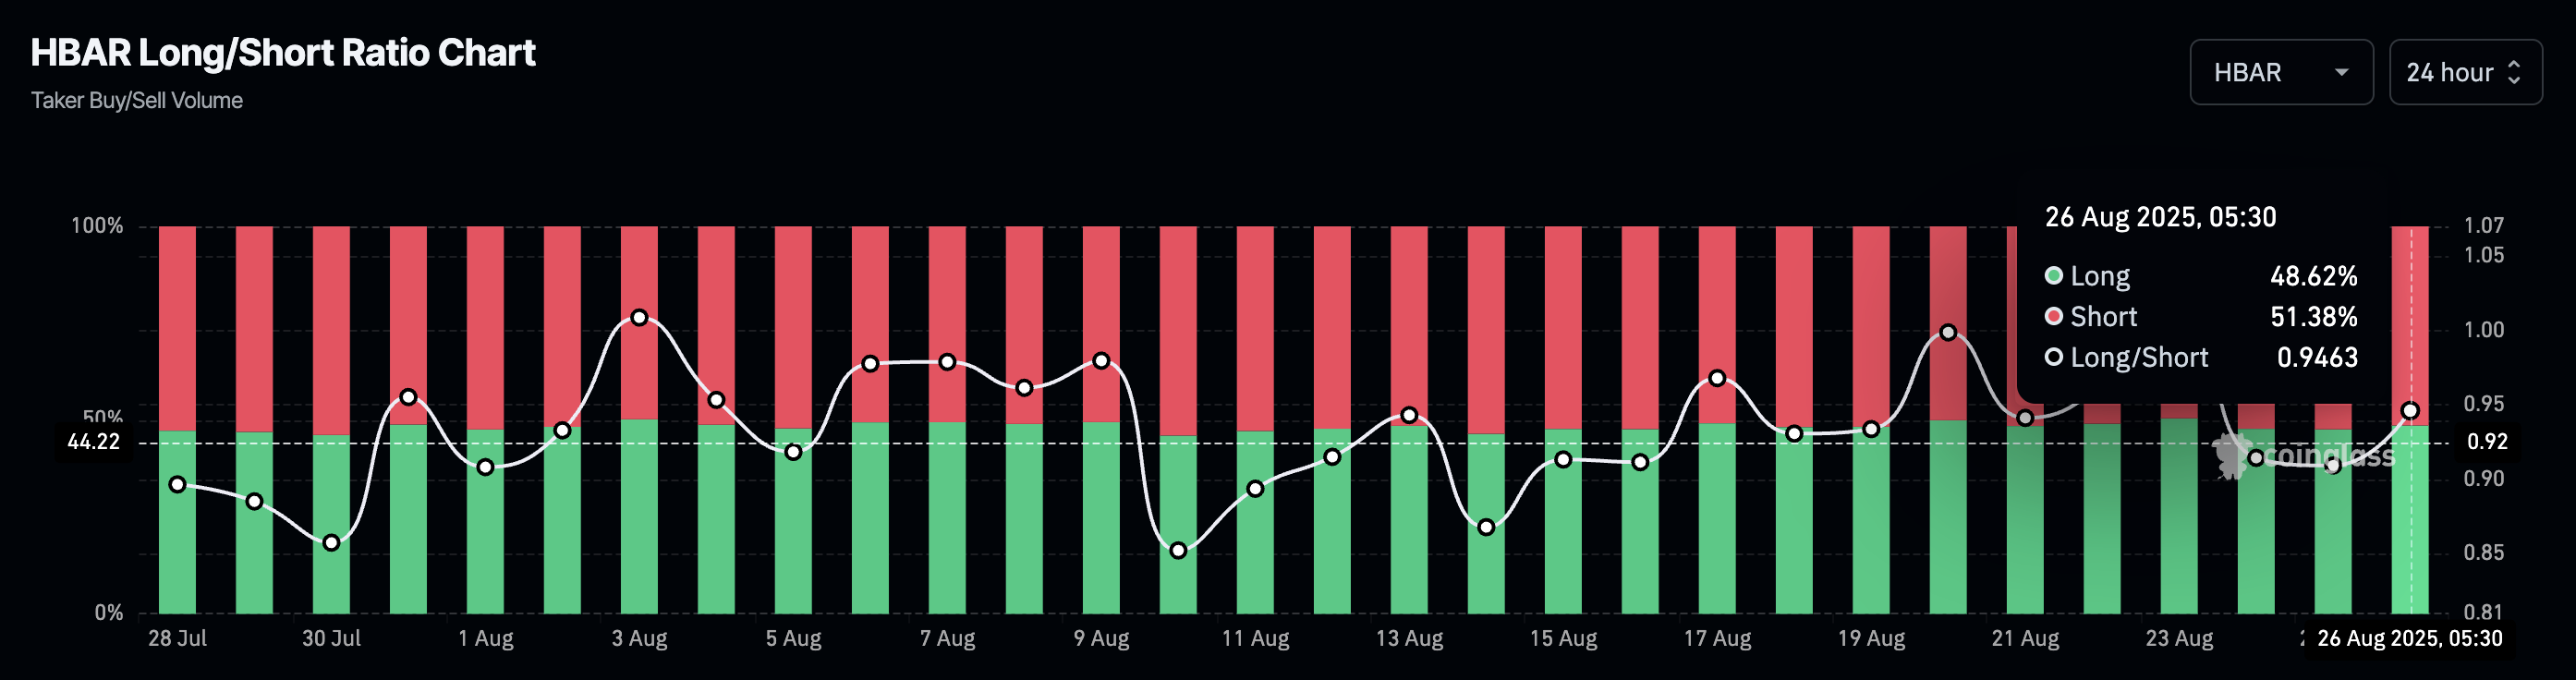
HBAR Long/Short ratio chart. Source: Coinglass
Hedera leaps off from a crucial support
Hedera bounces off the $0.22885 support level by nearly 2% on the day, halting the three-day streak of downfall. The public ledger token eyes to reclaim the 50-day Exponential Moving Average (EMA) at $0.23643, which could reinstate a recovery run.
A potential close above this dynamic average line could target the $0.26606 level, last tested on August 14.
The Moving Average Convergence Divergence (MACD) and its signal line are on the verge of falling below the zero line. This would signal a sell signal with a bearish shift in trend momentum
The Relative Strength Index (RSI) at 45 hovers slightly under the halfway line, maintaining a neutral stance.
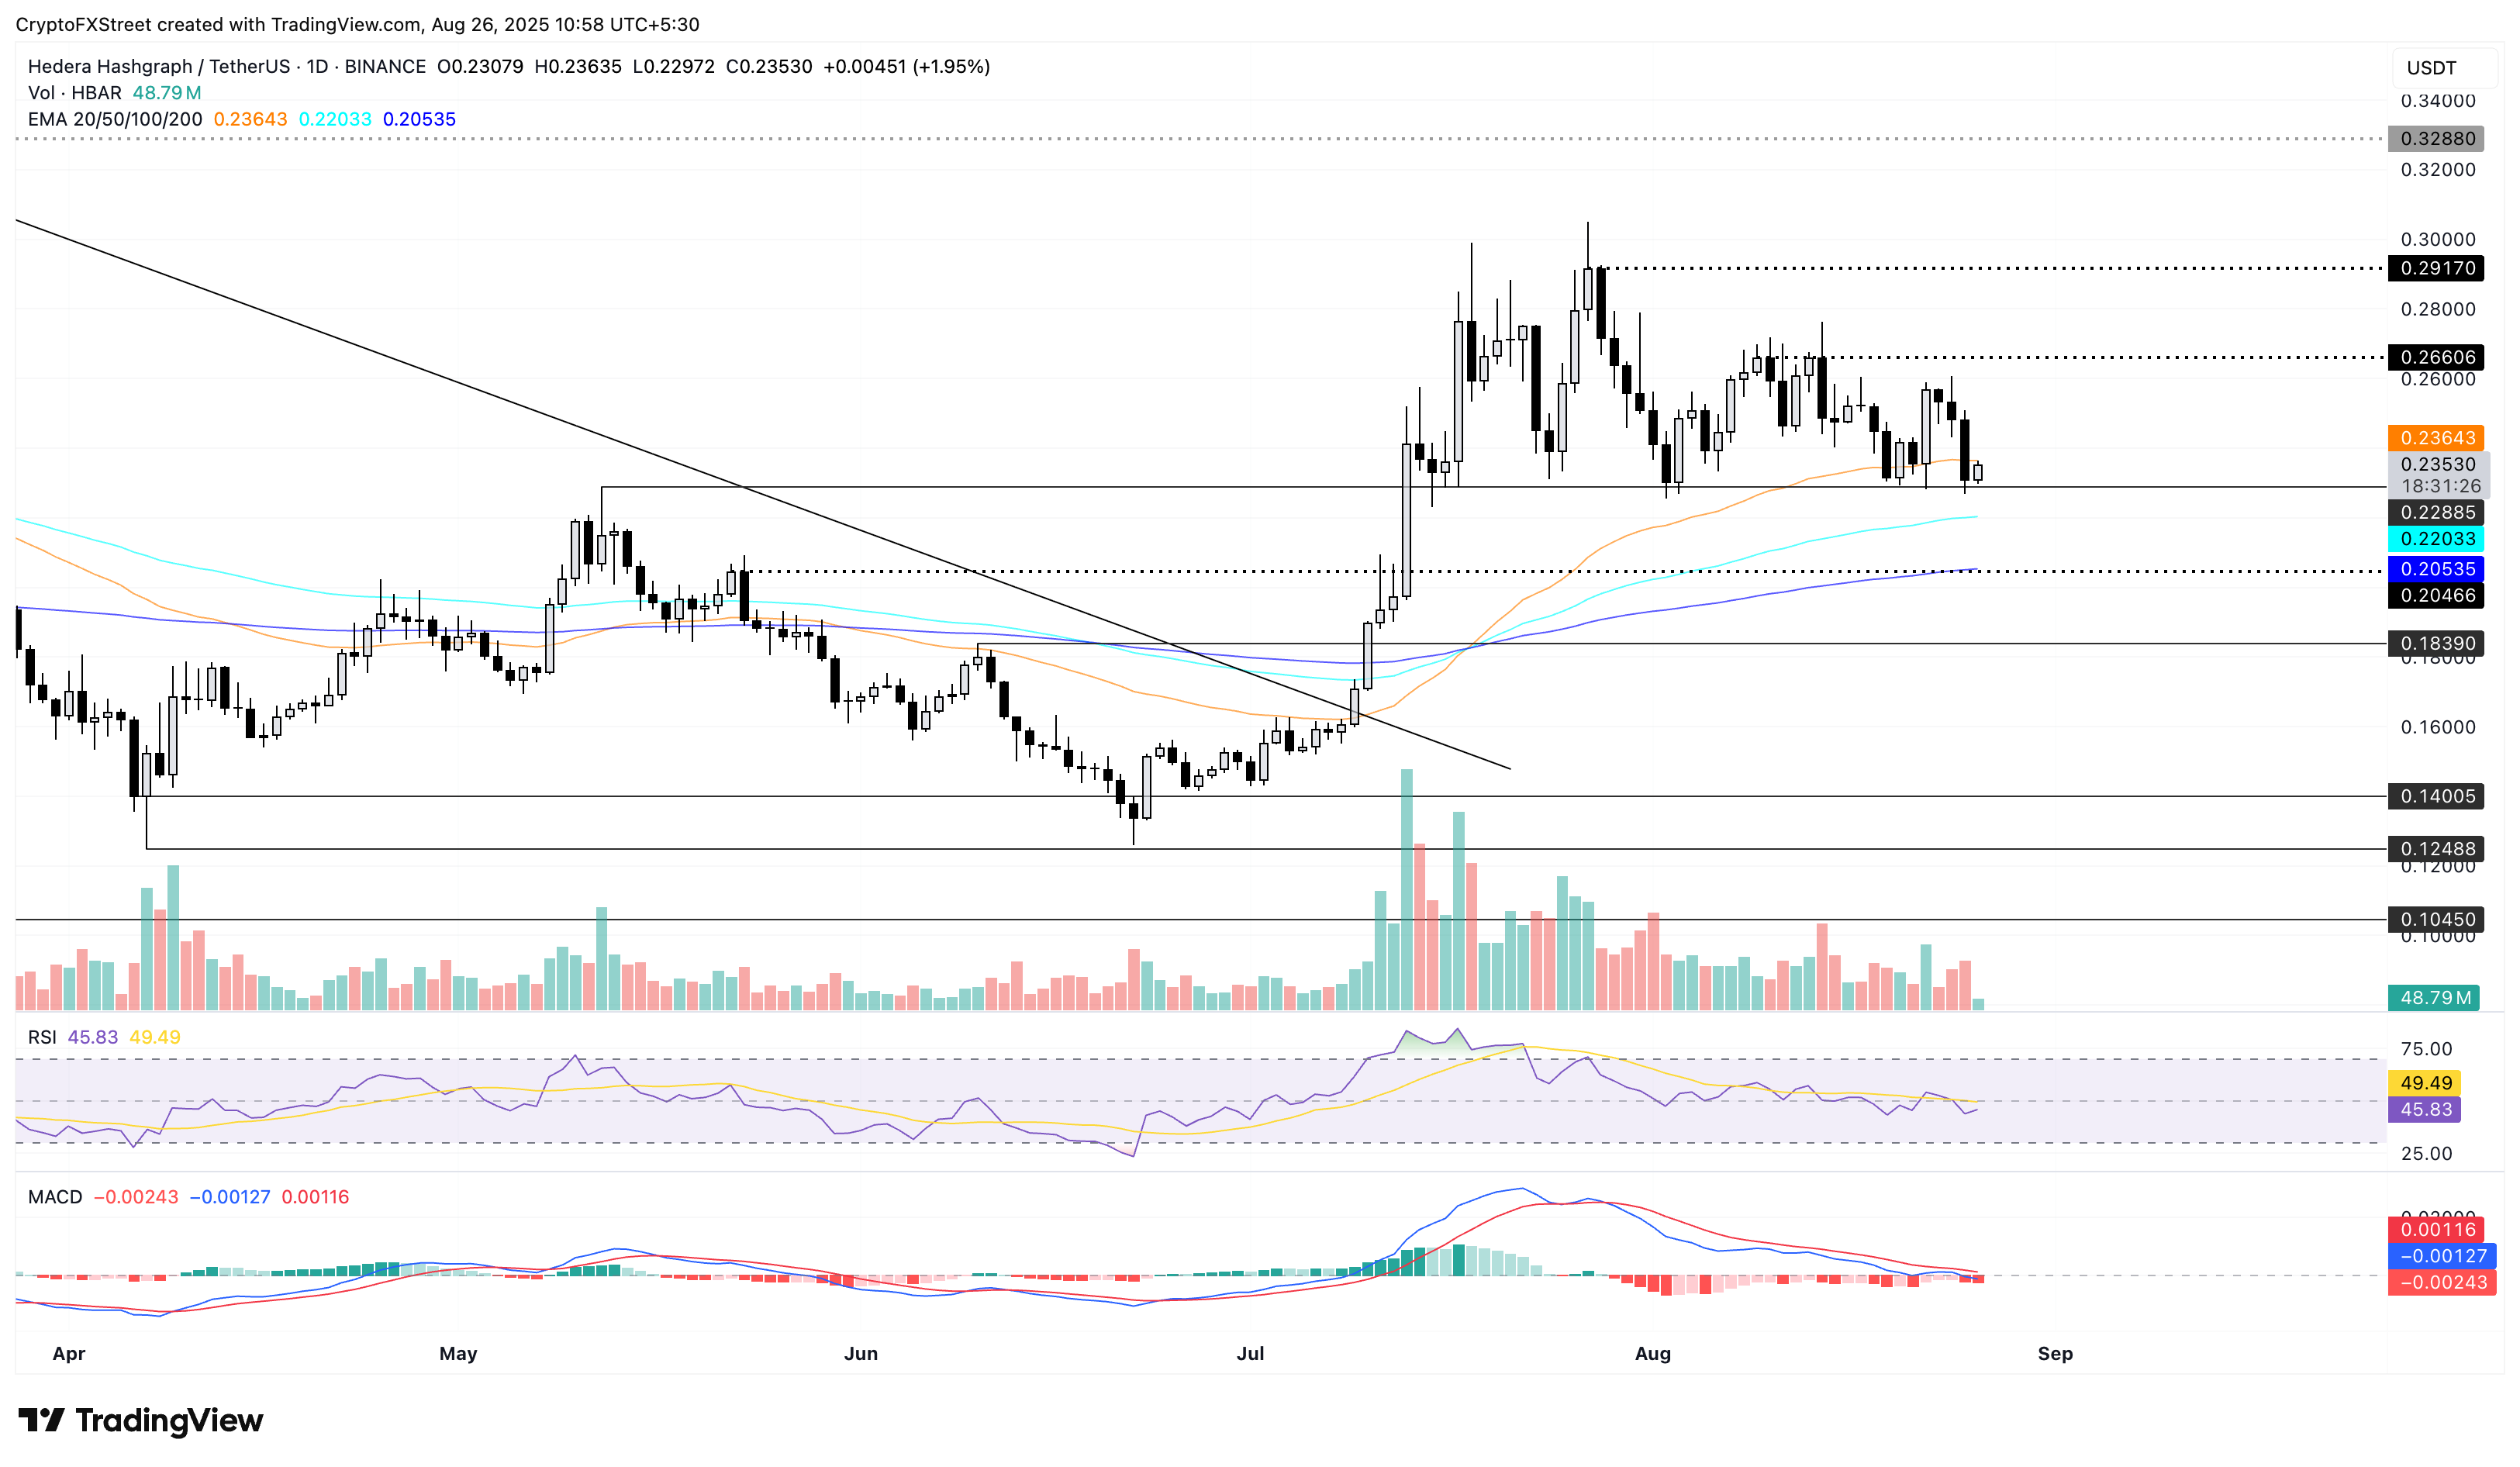
HBAR/USDT daily price chart.
Looking down, if HBAR slips below the $0.22885 level, it could extend the decline to the 100-day EMA at $0.22033.
Author

Vishal Dixit
FXStreet
Vishal Dixit holds a B.Sc. in Chemistry from Wilson College but found his true calling in the world of crypto.



