Fartcoin, Pepe, Dogwifhat offer bearish signals as meme coins falter despite Bitcoin's steady rise
- Meme coins collectively fell 4.7% over the past 24 hours, led by FARTCOIN, PEPE and WIF.
- Pepe extends losses below $0.0000100, testing support around $0.0000090 while the futures open interest plunges.
- Dogwifhat losses gain momentum, targeting key support at $0.70 as the derivatives market's open interest falls to $334 million.

The cryptocurrency market experienced a rollercoaster ride in June amid geopolitical tensions and macroeconomic uncertainty. Despite Bitcoin's (BTC) paring losses incurred after Israel launched attacks on Iran, the meme coin sector has seen a subdued recovery, with leading tokens including Fartcoin (FARTCOIN), Pepe (PEPE), and Dogwifhat (WIF) extending losses on Thursday.
Meme coins Fartcoin, Pepe, Dogwifhat extend losses
Collectively, meme coins declined 4.7% over the past 24 hours, while Bitcoin's price ticked higher, briefly surpassing $108,000 on Thursday. Fartcoin and Dogwifhat sustained a near 10% decline, with Pepe falling 7.5% in the same 24-hour period.
The bearish outlook across the meme coin segment indicates that traders are aligning with major crypto assets, such as Bitcoin, Ethereum (ETH), and Ripple (XRP), which continue to hold most of the gains accrued this week.
Fartcoin on the verge of escalating downside risks
Fartcoin is currently trading at $0.96, upholding a near 3% decline on the day. The meme coin's upside is capped under the 200-period Exponential Moving Average (EMA) at $0.99 on the 12-hour chart.
A death cross pattern formed when the 50-period EMA crossed below the 100-period EMA on Monday, implying bearish dominance and likely keeping FARTCOIN weighed down toward the next key support area at $0.80, last tested on Sunday.
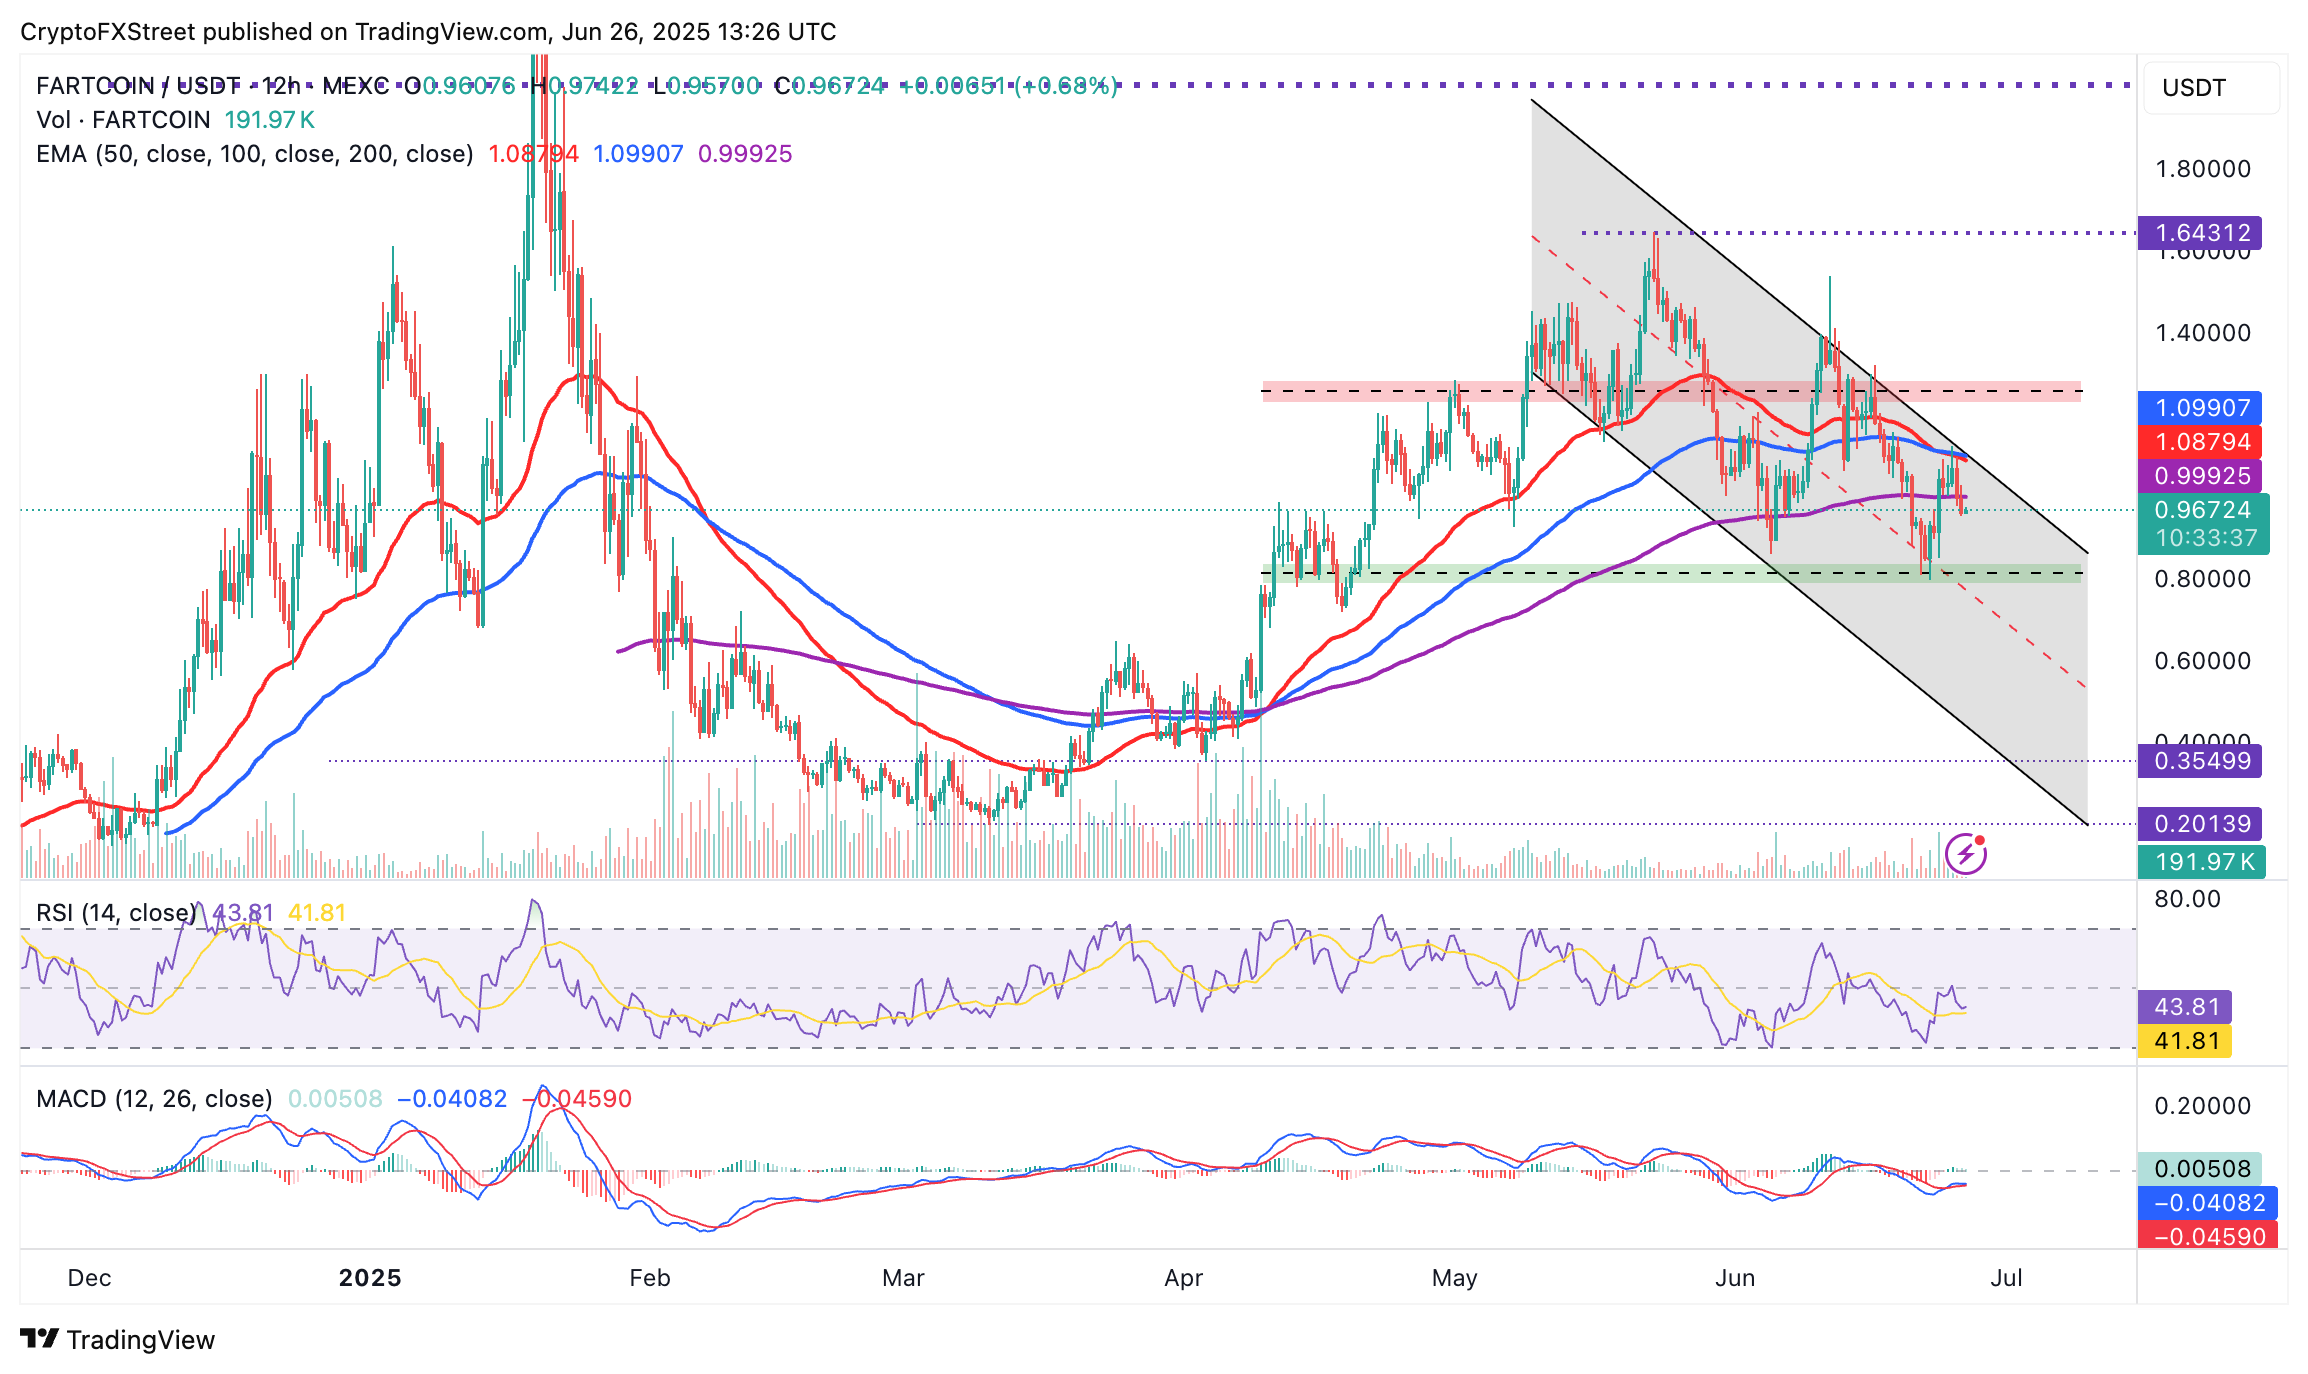
FARTCOIN/USDT 12-hour chart
Still, a recovery attempt cannot be ruled out, especially with the Relative Strength Index (RSI) showing signs of an upward reversal at 42. A potential swing above the 50 midline could signal bullish momentum, paving the way for gains past the $1.25 resistance tested on June 17.
Pepe bulls on the back foot
Pepe upholds a bearish outlook, down almost 2% on the day to trade at $0.00000930. Since the meme coin fell from its May peak of $0.00001632, it has shed almost 43% of its value, highlighting a loss of interest in PEPE.
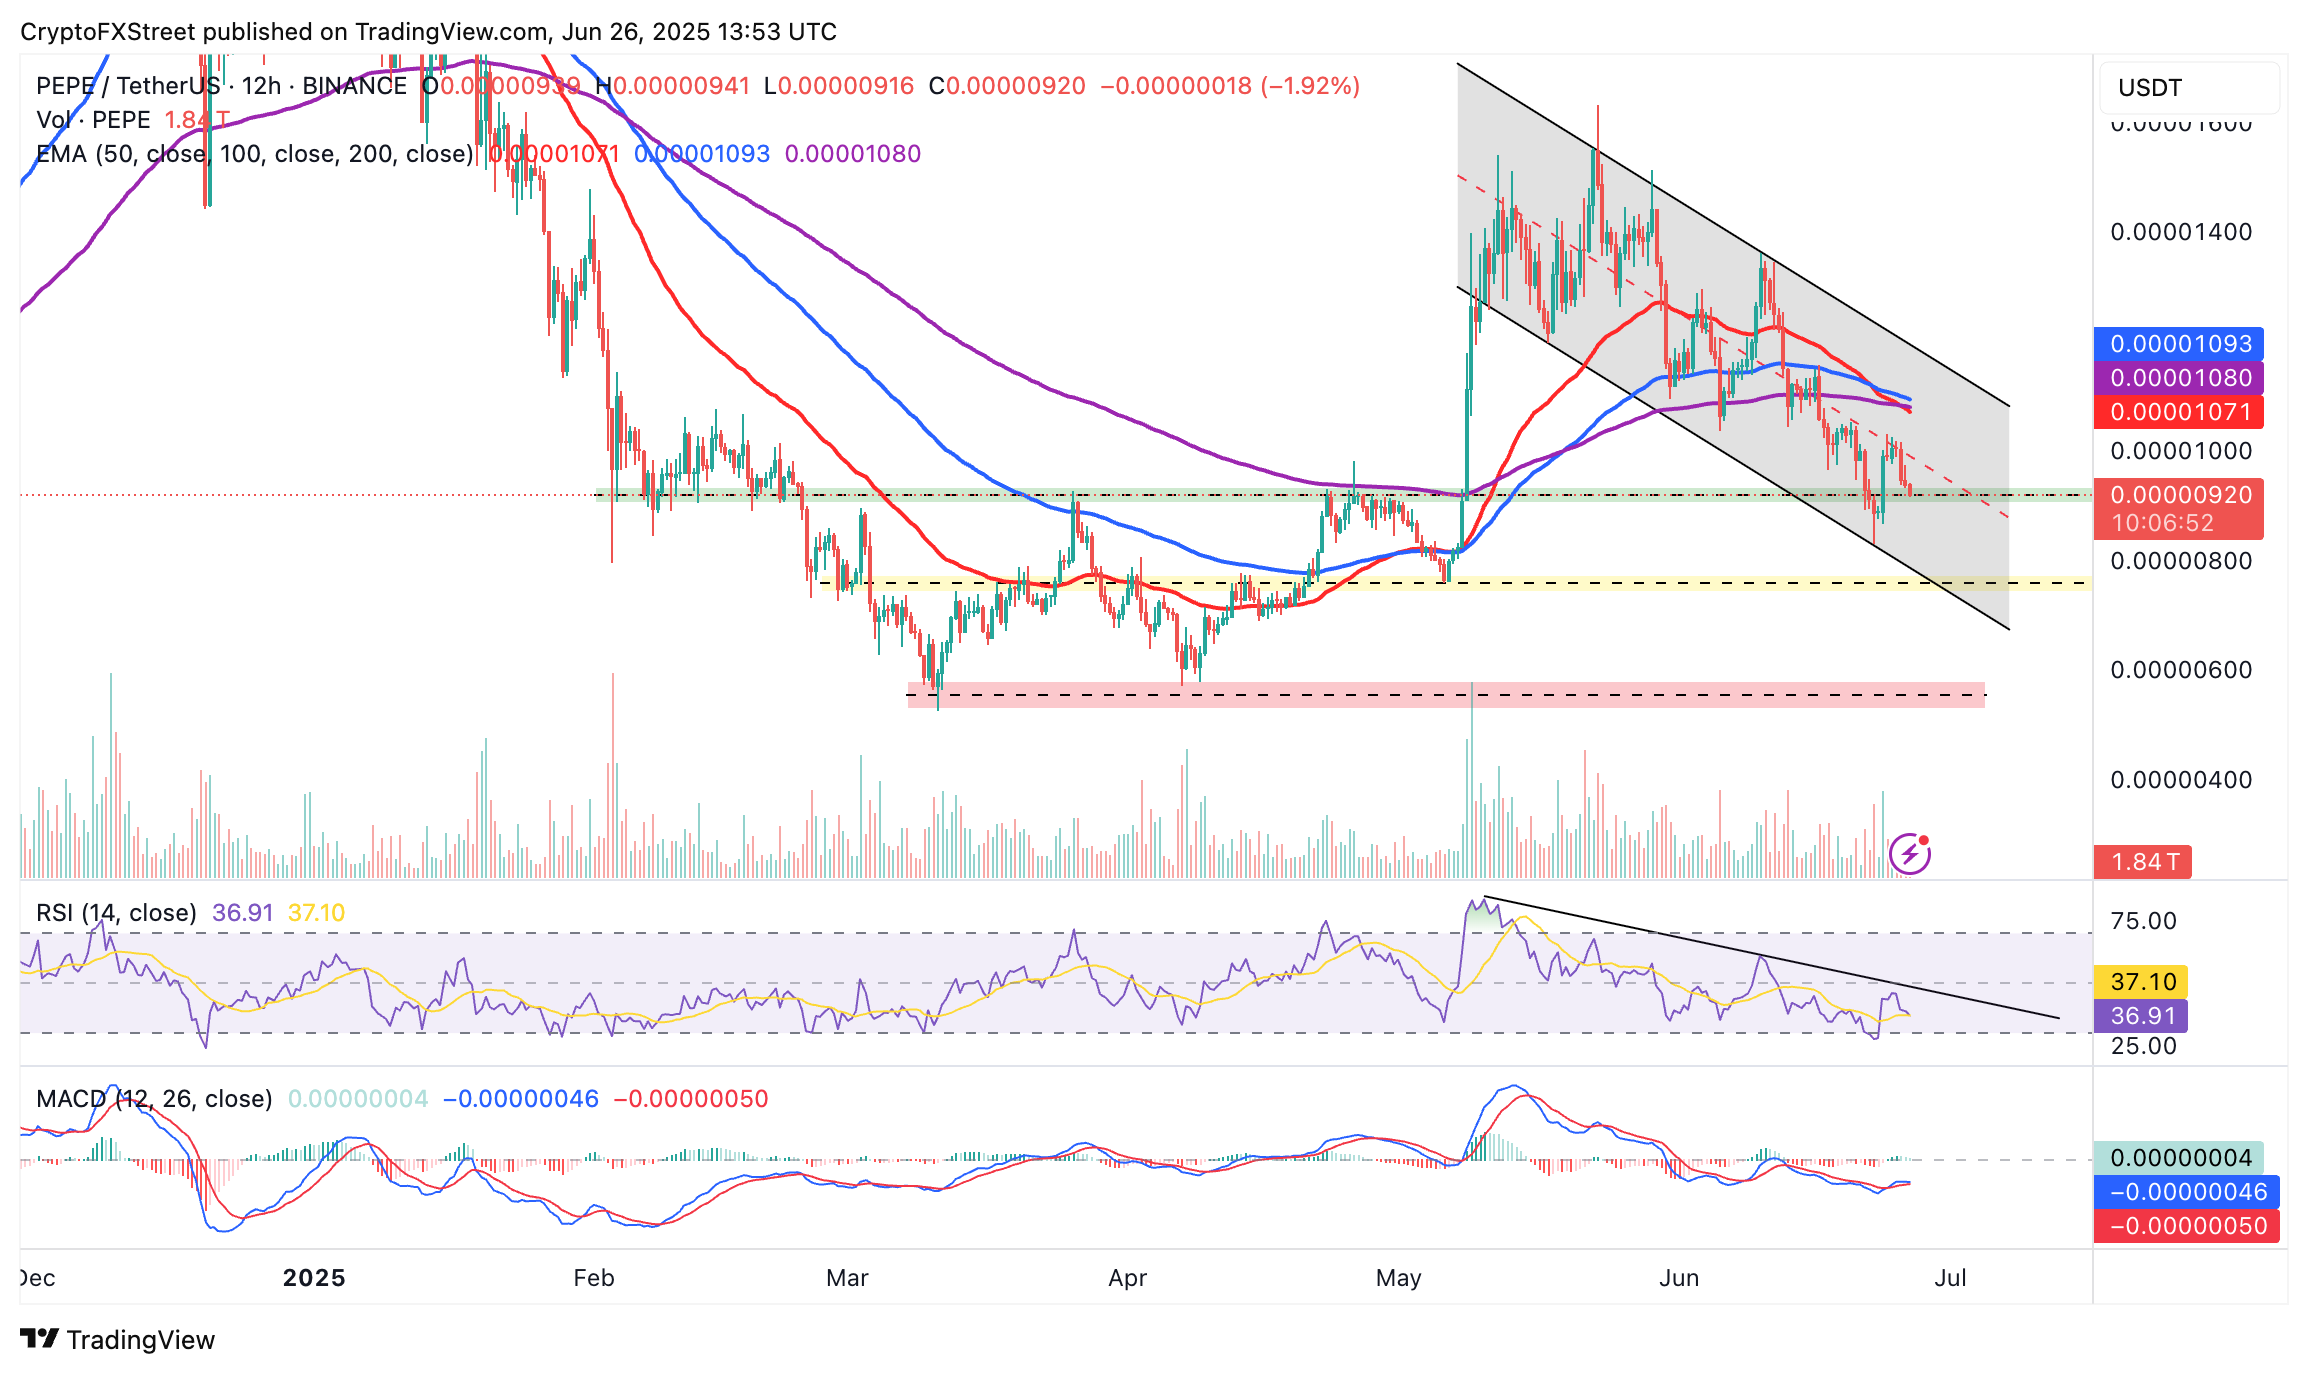
PEPE/USDT 12-hour chart
CoinGlass derivatives market data highlights the lack of trader activity in PEPE, particularly with the futures contracts' Open Interest (OI) plummeting to $491 million. The subsequent surge in long positions liquidations to $1.31 million over the past 24 hours, compared to about $743,000 in short positions, suggests that sellers have the upper hand.
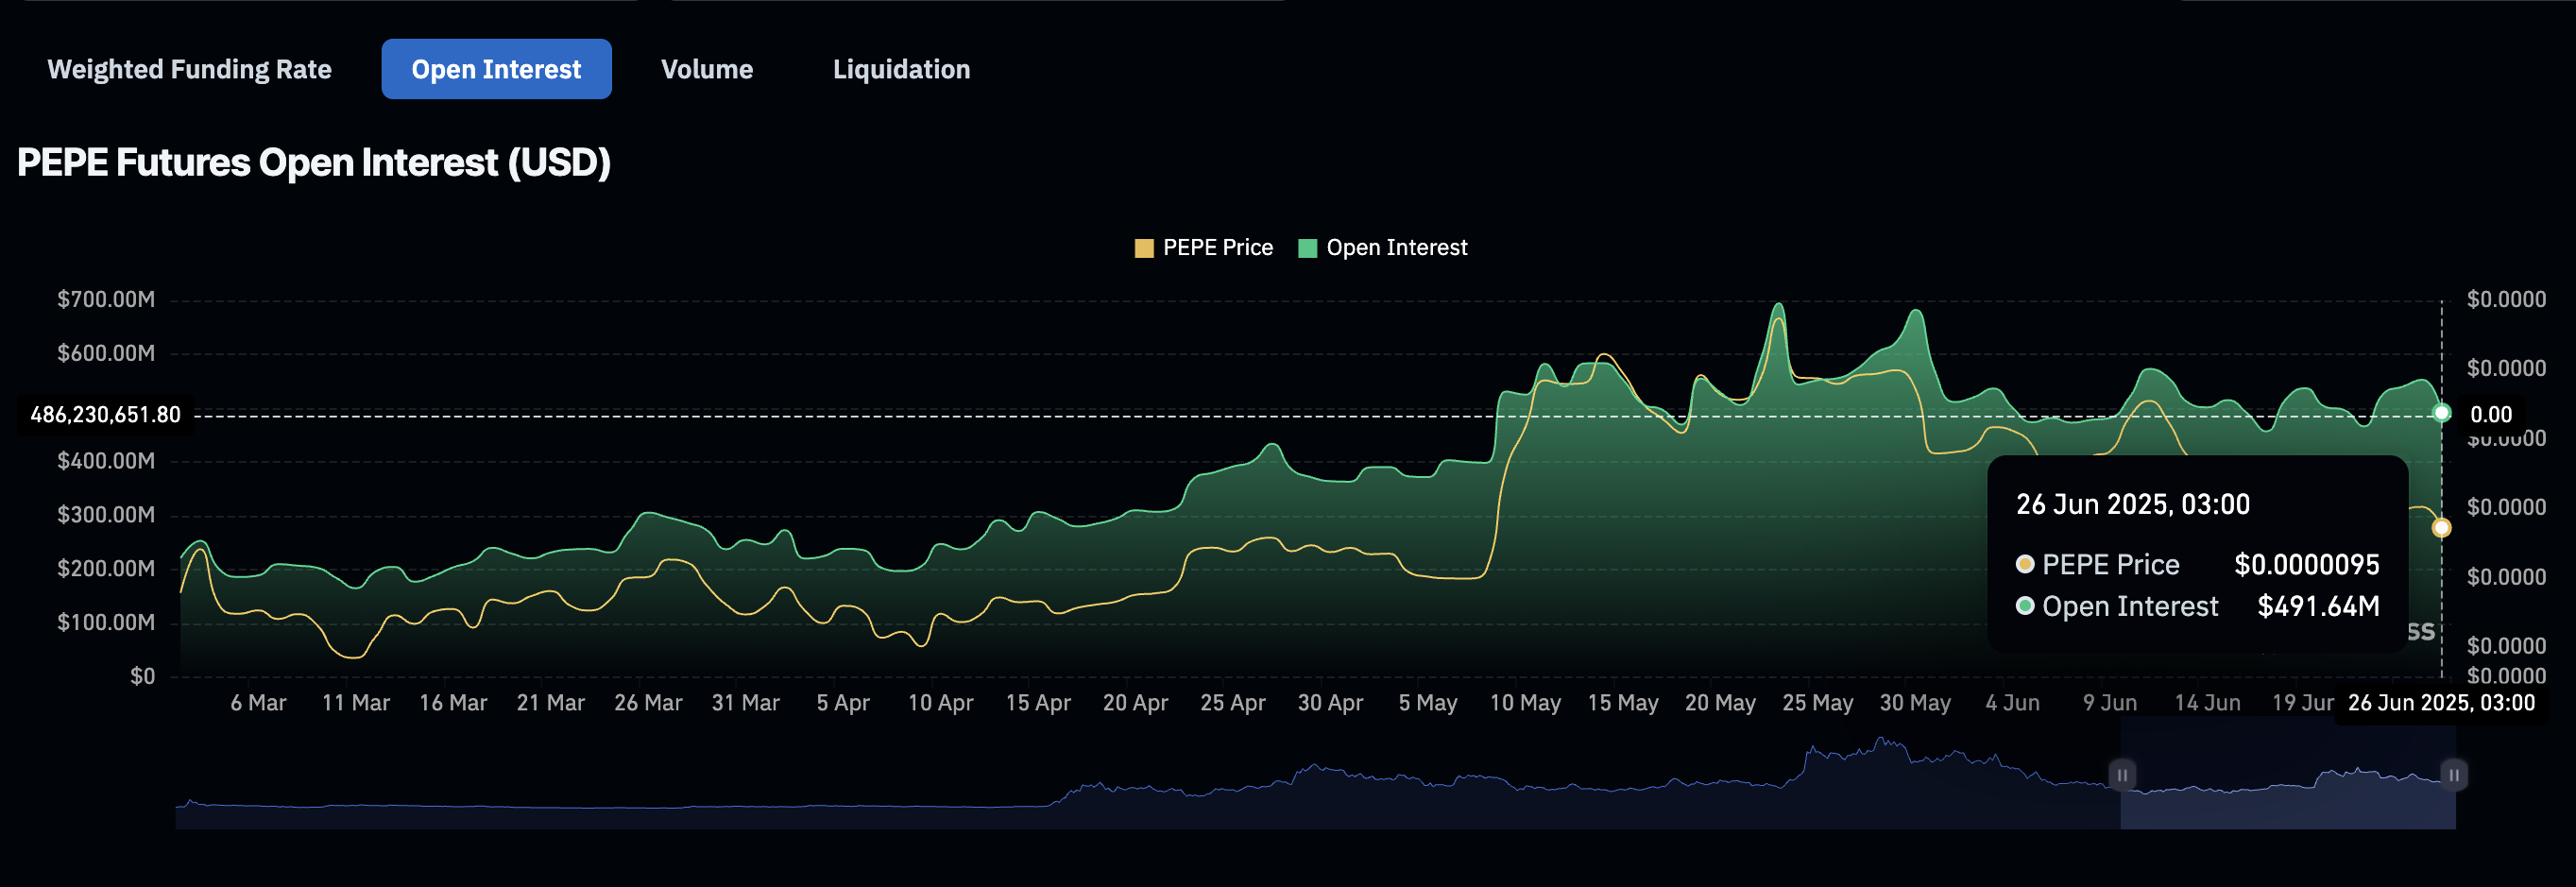
Pepe Futures Open Interest | Source: CoinGlass
The path of least resistance could remain downward in the coming sessions, underpinned by a death cross pattern formed when the 50-period EMA crossed below the 200-period EMA on the 12-hour chart. Tentative support levels to keep in mind include $0.00000750, which was last tested in early May, and $0.00000600, probed in April.
Dogwifhat upholds bearish structure
Dogwifhat's price is trading at $0.75 after intraday losses exceeded 5%. Its downside risks are on overdrive, accentuated by an 8.4% drop in the derivatives market's Open Interest to $334 million, according to CoinGlass data.
The downtrend that has been sustained since WIF peaked at $1.39 in May has resulted in frequent massive liquidations, with approximately $2 million lost in long positions over the last 24 hours and roughly $375,000 in short positions.
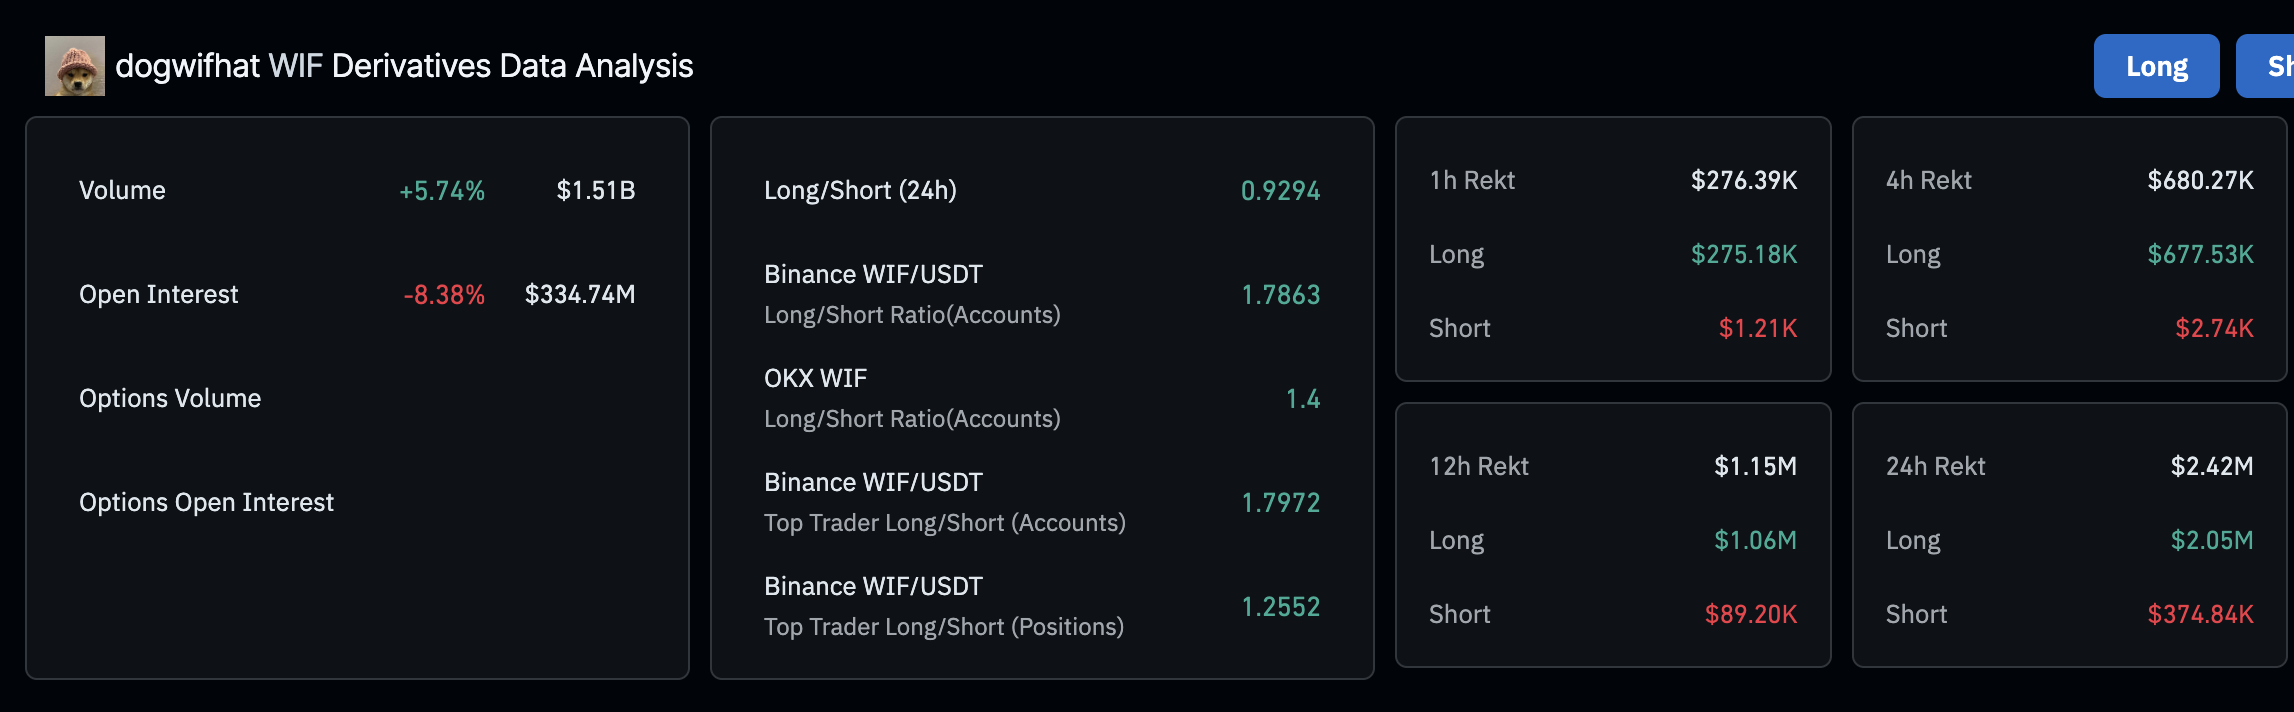
Dogwifhat derivatives market data | Source: CoinGlass
Meanwhile, the Moving Average Convergence/Divergence (MACD) indicator, which has been stuck below the zero line on the 12-hour chart since June 12, is poised to flash a sell signal, potentially boosting risk-off sentiment. A sell signal manifests when the blue MACD line crosses below the red signal line.
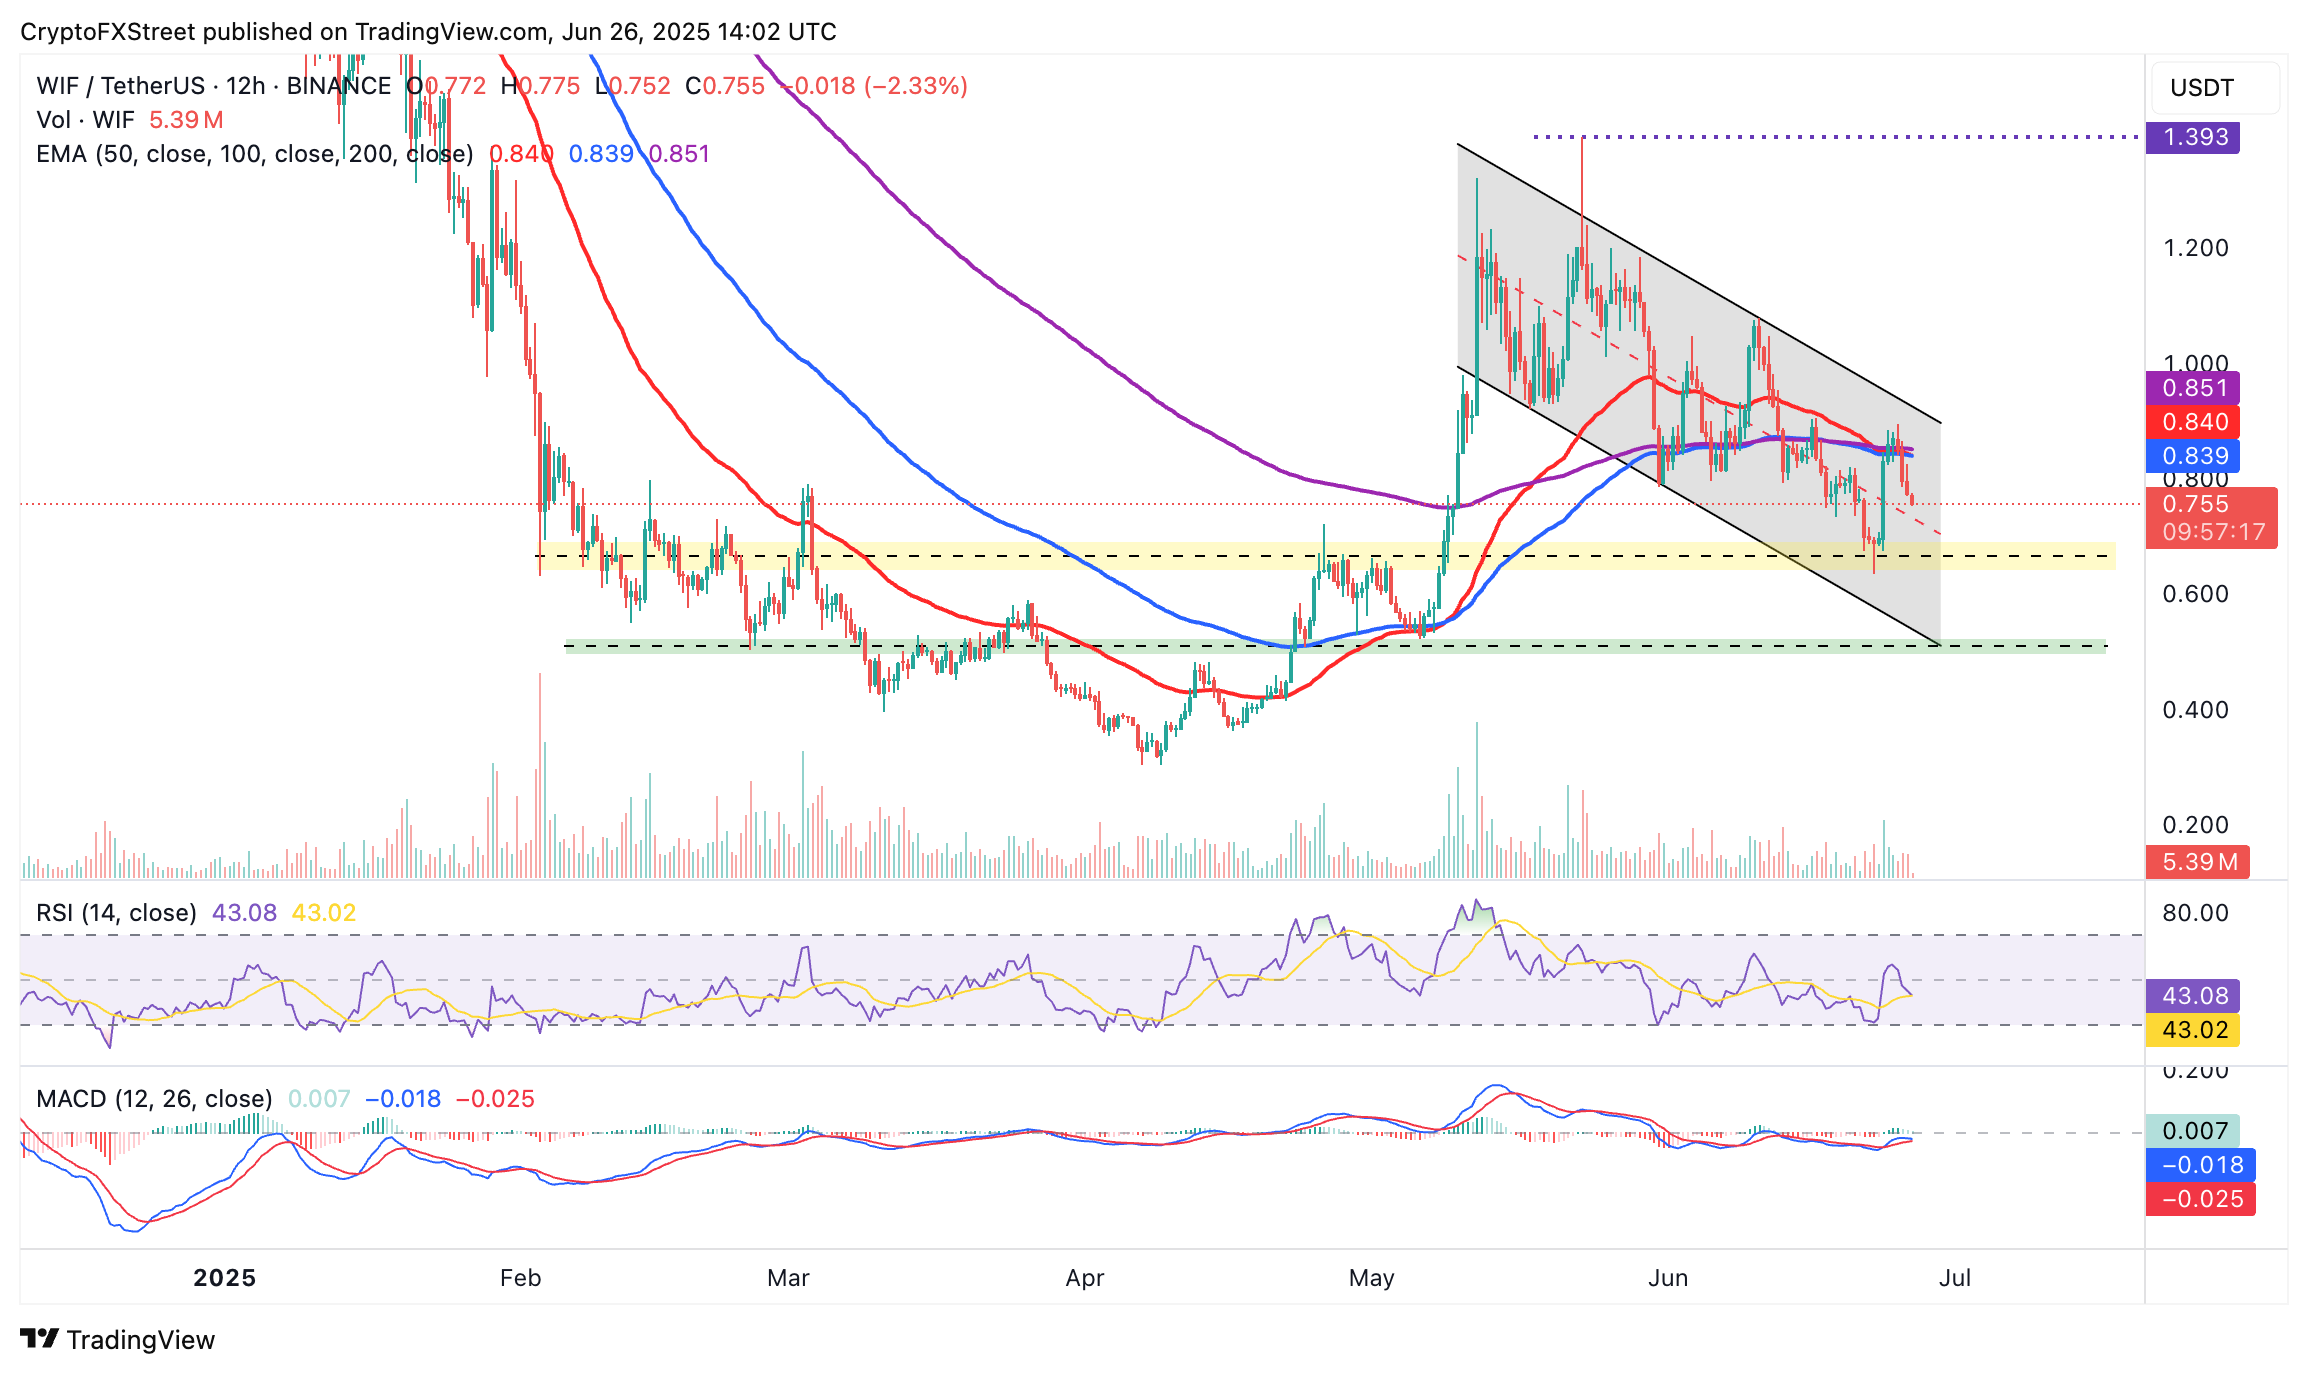
WIF/USDT 12-hour chart
Key areas of interest to traders include the middle boundary of the descending channel, the demand area at $0.60, which was tested on Sunday, and the seller congestion at $0.51, previously probed as support in late May and early June.
Cryptocurrency prices FAQs
Token launches influence demand and adoption among market participants. Listings on crypto exchanges deepen the liquidity for an asset and add new participants to an asset’s network. This is typically bullish for a digital asset.
A hack is an event in which an attacker captures a large volume of the asset from a DeFi bridge or hot wallet of an exchange or any other crypto platform via exploits, bugs or other methods. The exploiter then transfers these tokens out of the exchange platforms to ultimately sell or swap the assets for other cryptocurrencies or stablecoins. Such events often involve an en masse panic triggering a sell-off in the affected assets.
Macroeconomic events like the US Federal Reserve’s decision on interest rates influence crypto assets mainly through the direct impact they have on the US Dollar. An increase in interest rate typically negatively influences Bitcoin and altcoin prices, and vice versa. If the US Dollar index declines, risk assets and associated leverage for trading gets cheaper, in turn driving crypto prices higher.
Halvings are typically considered bullish events as they slash the block reward in half for miners, constricting the supply of the asset. At consistent demand if the supply reduces, the asset’s price climbs.
Author

John Isige
FXStreet
John Isige is a seasoned cryptocurrency journalist and markets analyst committed to delivering high-quality, actionable insights tailored to traders, investors, and crypto enthusiasts. He enjoys deep dives into emerging Web3 tren



