|

Fantom Technical Analysis: FTM/USD resumes its bullish momentum after a brief consolidation eying up $0.015

  • After hitting a new 2020-high at $0.014, FTM/USD started a healthy consolidation towards $0.01. 
  • FTM bulls are back in town eying up the recent high at $0.014 and $0.015. 

Fantom experienced a massive 135% surge in three days setting a new 2020-high. FTM/USD had a significant increase in trading volume and the daily RSI got heavily overextended. The digital asset had a healthy consolidation period of two days hitting a low of $0.0102 before resuming its bullish momentum. 

FTM/USD daily chart

ftmusd

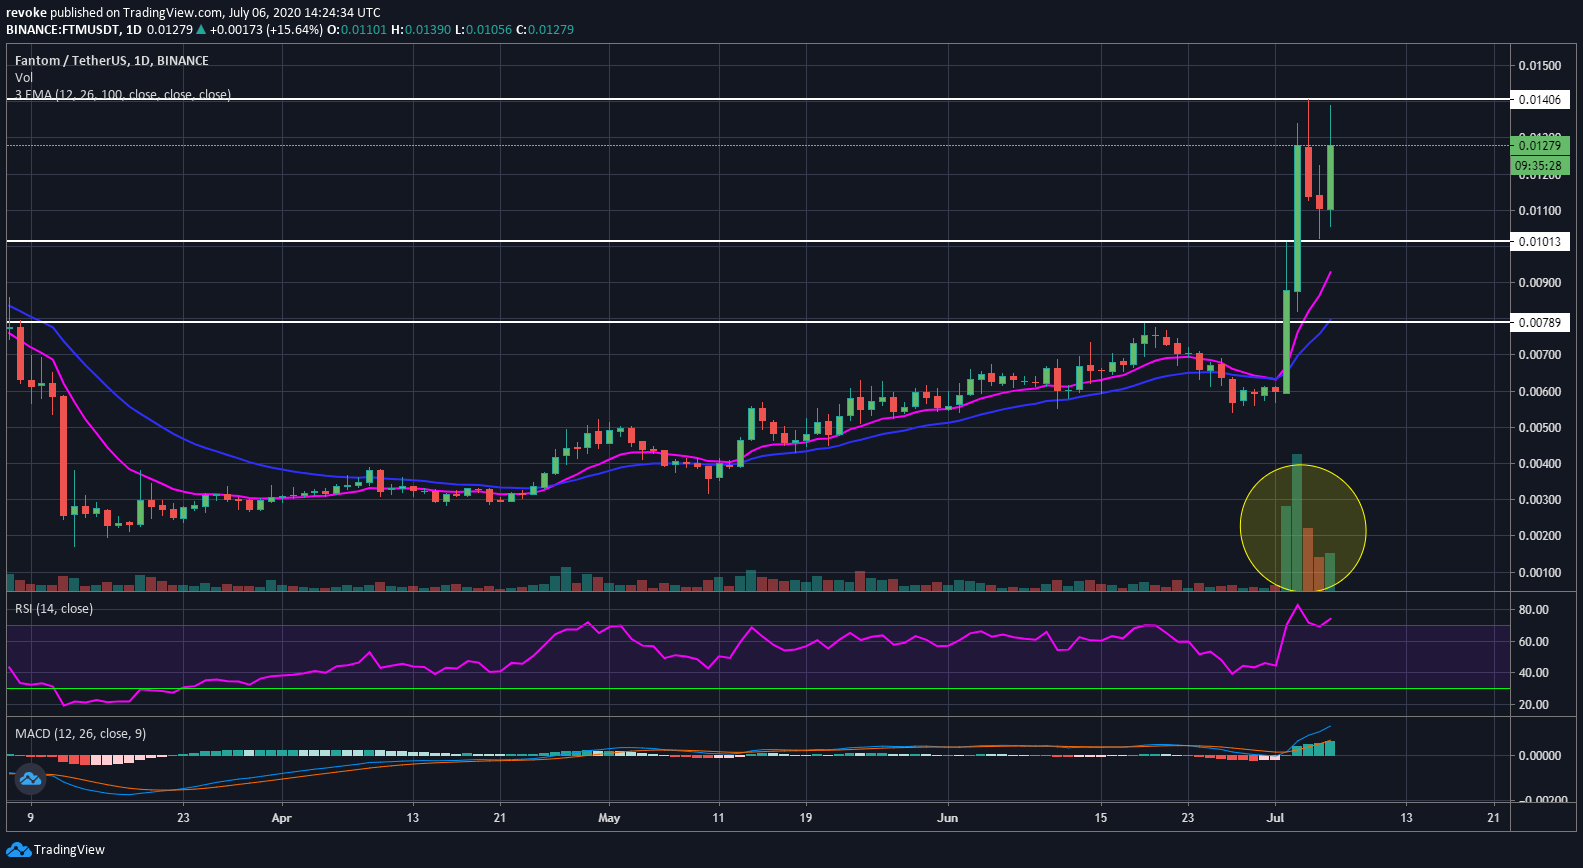
Fantom looks ready to crack $0.014 and continue towards $0.015 as there is very little resistance until that level. Buyers will need to break $0.0145, but after that, they have a free run until almost $0.016. The daily RSI has cooled off but remains overextended, however, this indicator will not necessarily stop bulls from climbing above the last high. 

FTM/USD 4-hour chart

ftmusd

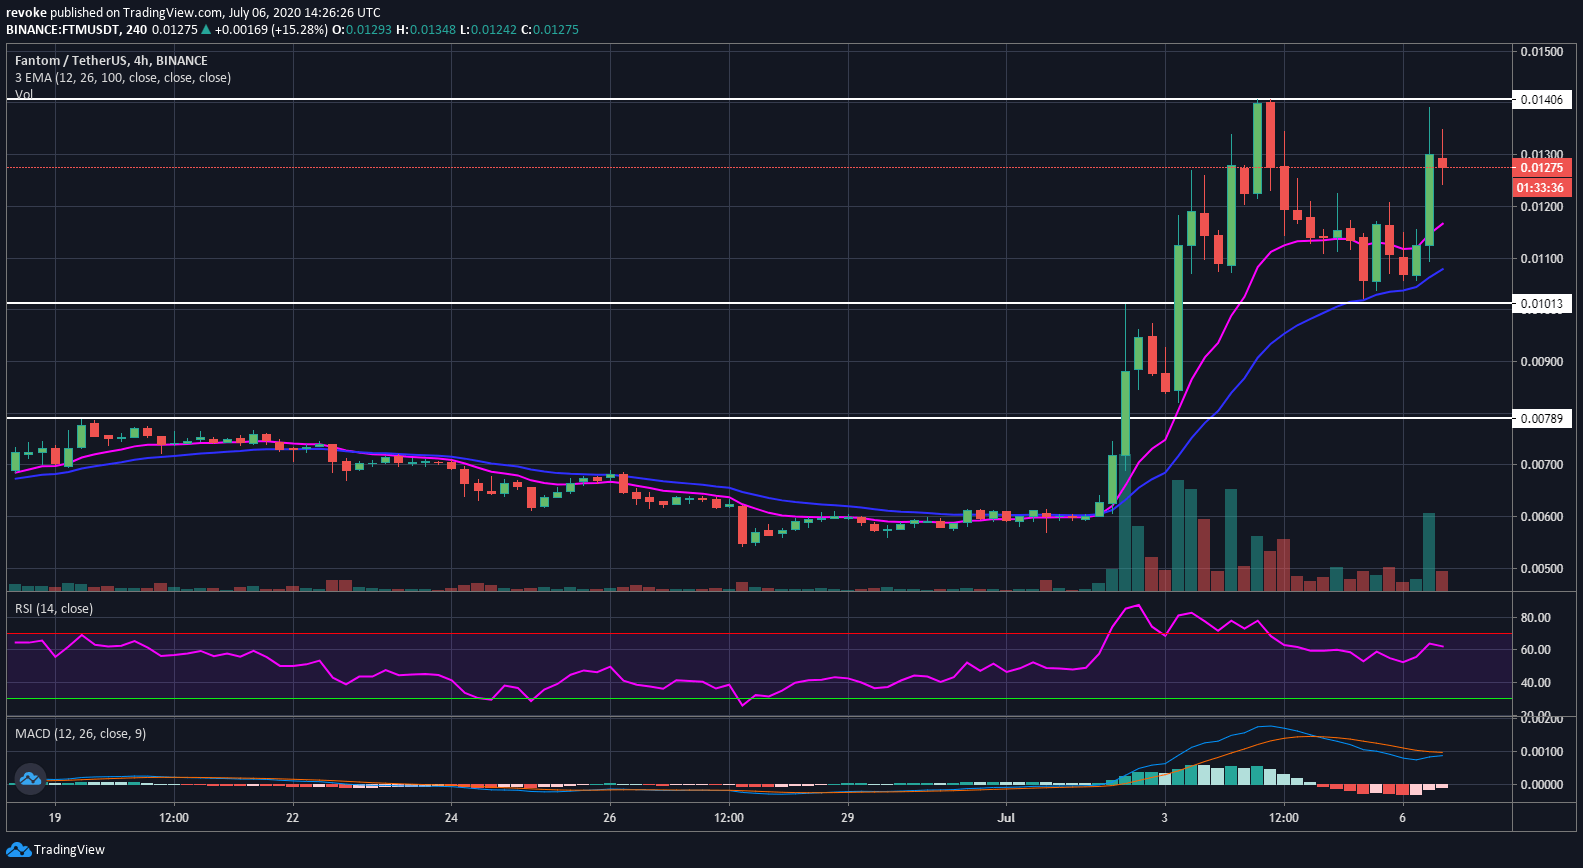
Fantom is back trading inside a 4-hour uptrend after defending the 26-EMA several times in a row. FTM/USD is currently above both EMAs which have remained bullish and will continue to act as support levels if needed. The MACD is still bearish but on the verge of a bull cross while the RSI is slightly under the overextended level.

Author

Lorenzo Stroe

Lorenzo Stroe

Independent Analyst

Lorenzo is an experienced Technical Analyst and Content Writer who has been working in the cryptocurrency industry since 2012. He also has a passion for trading.

More from Lorenzo Stroe
Share:

Editor's Picks

Ripple technical weakness persists as selling intensifies toward $1.00

Ripple grinds lower, trading around $1.10 at the time of writing on Wednesday. The sticky bearish outlook mirrors the broader crypto market, with major coins such as Bitcoin and Ethereum facing weak demand as investors de-risk.

Crypto Today: Bitcoin, Ethereum, XRP face downside pressure amid investor de-risking

Major crypto assets trade under intense headwinds on Wednesday, as market participants navigate complex geopolitical and macroeconomic environments. Bitcoin has slipped toward $61,000 after its recent rebound was sold near $64,000, leaving buyers exhausted.

Bitcoin Price Forecast: Sticky inflation fears threaten deeper sell-off in BTC

Bitcoin extends its decline on Wednesday, trading below $61,500 at the time of writing as renewed US-Iran tensions keep the risk sentiment capped. In addition, persistent capital outflows from US-listed spot Exchange Traded Funds continue to fuel selling pressure on BTC.

Pi Network extends decline as CEX outflows fail to offset bearish pressure

Pi Network edges lower on Wednesday, extending its third consecutive day of losses. The technical outlook for PI is largely bearish, with a risk of a steeper correction below $0.1184.

Bitcoin: After the bloodbath, everyone looks at $60,000
Bitcoin (BTC) hovers above $62,000 at the time of writing on Friday, weighed down by growing risk-off sentiment due to persistent geopolitical tensions in the Middle East and sticky macroeconomic uncertainty. The institutional sell-off continued to wreak havoc on capital flows, with spot Bitcoin Exchange-Traded Funds (ETFs) recording billions in outflows.