Fantom Price Prediction: Investors taking profits but the uptrend prevails
- Fantom price is up 170% since January
- The Relative Strength Index suggests the uptrend could trade rangebound near $0.65.
- A breach of the $0.47 liquidity zone could induce a steeper pullback.

Fantom price has displayed stunning market behavior. While investors secure profit, the uptrend shows the possibility that it can continue towards higher price levels in the coming weeks. still, this article assesses Phantom's short-term technicals to forecast the next price swing.
Fantom price is taking off
Fantom price has outperformed most cryptocurrencies with a 217% rally to a high of $0.655 since January 1st. A brief consolidation is occurring near the $0.53 level, bringing the 5-week gain to 170%.
Fantom price currently auctions at $0.53. The scalable smart contract token is currently trading just below the 8-day exponential moving average, but the 21-day simple moving average remains untested. Investors are expecting A tag of this indicator to act as support as it would be the first engagement since the rally's initial stages on January 5th, when FTM traded at $0.20.
The Relative Strength Index shows FTM's uptrend in overbought territory, defining the uptrend move as a genuine rally. The consolidation also shows bullish divergences, indicating that profit-taking transactions are being absorbed by the underlying strength of the trend.
Based on these factors, it is likely that FTM will continue to consolidate within the current $0.50 zone and move towards higher price targets near $0.65 in the coming weeks. The bullish scenario creates the potential for a 20% decline from FTM's current market value.
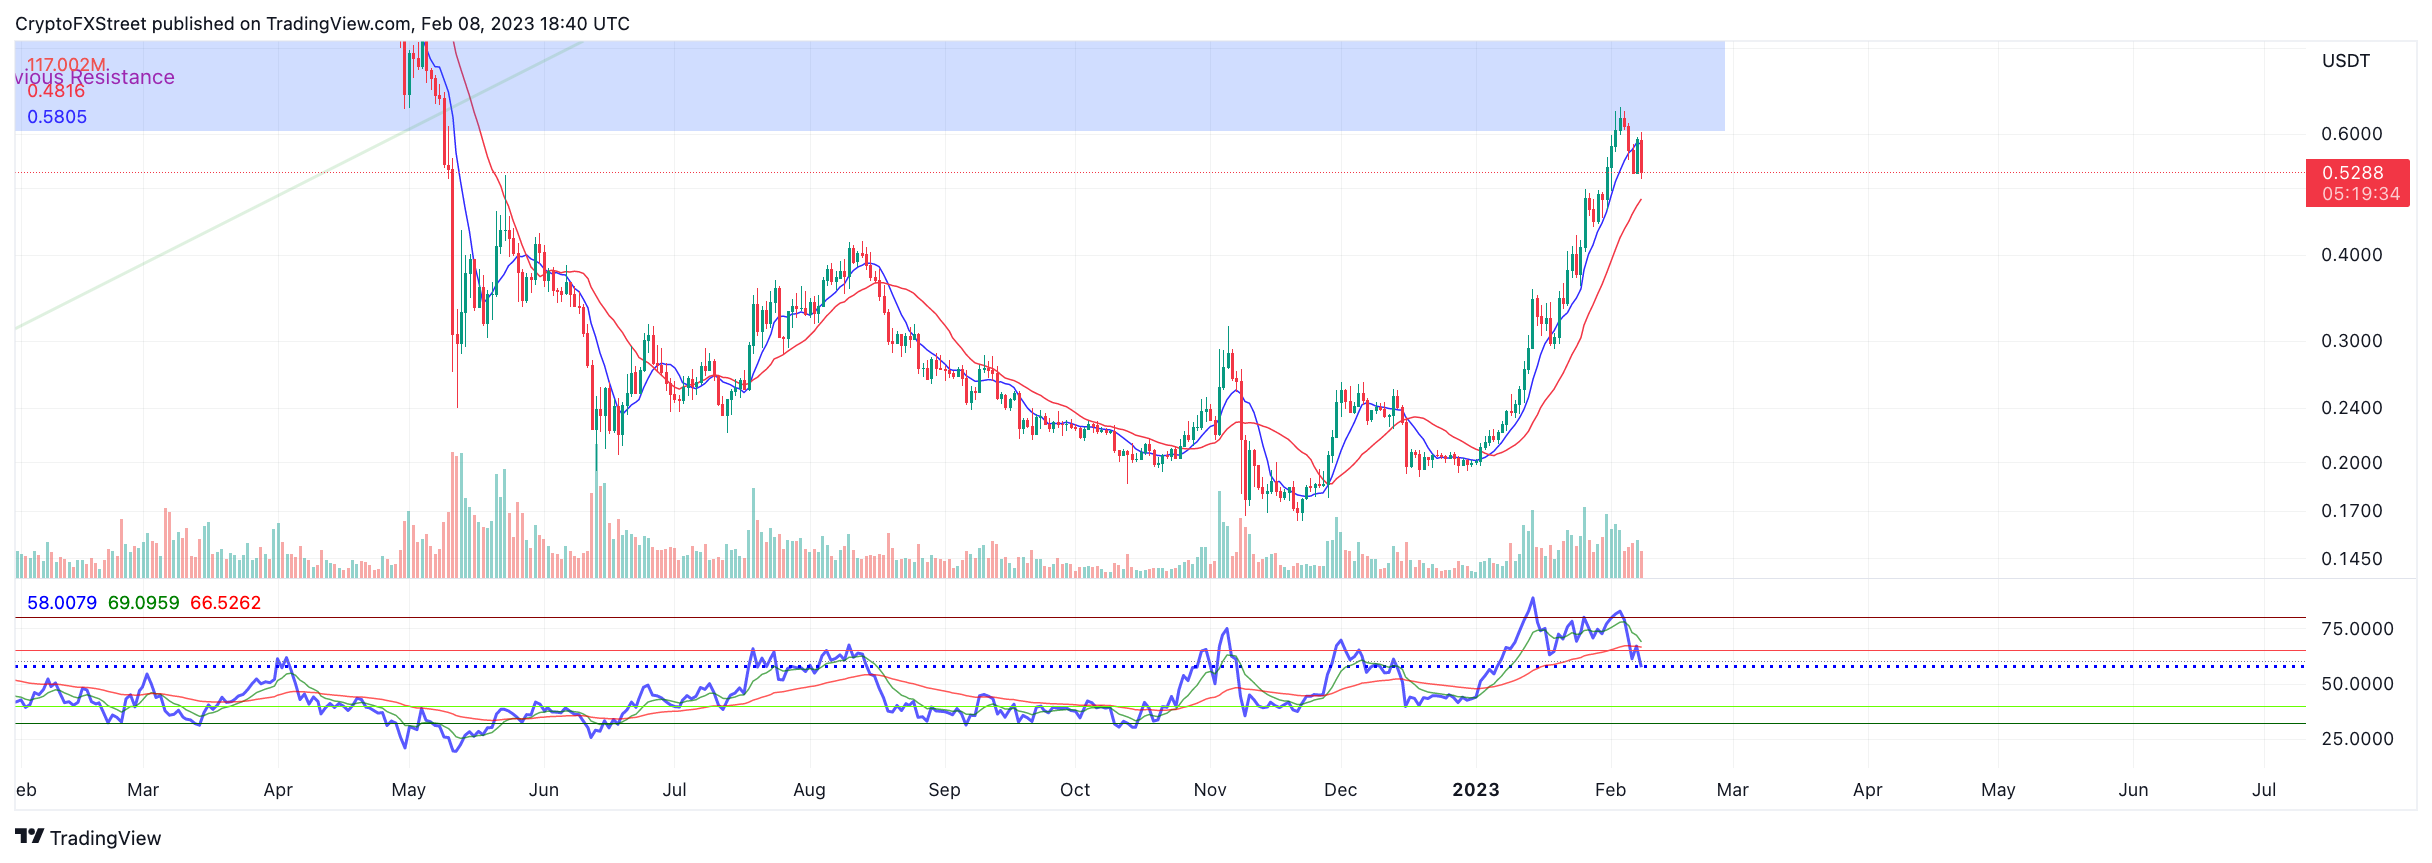
FTM/USDT 1-day chart
Traders should make sure to monitor the 21-day simple moving average moving forward. A daily closing candlestick below the indicator, marked at $0.47, could induce a deeper decline. The bears could challenge support levels as low as $0.27, which would result in a 52% decline from the current market value.
This video details how Bitcoin price moves could affect Fantom price
Author

Tony M.
FXStreet Contributor
Tony Montpeirous began investing in cryptocurrencies in 2017. His trading style incorporates Elliot Wave, Auction Market Theory, Fibonacci and price action as the cornerstone of his technical analysis.


