Ethereum/USD technical analysis

Ethereum / USD Technical Analysis Summary
Sell Stop: Below 3005.02
Stop Loss: Above 3060.65
| Indicator | Signal |
| RSI | Neutral |
| MACD | Buy |
| MA(200) | Sell |
| Fractals | Sell |
| Parabolic SAR | Buy |
| Accumulation/Distribution | Sell |
Ethereum / USD Chart Analysis
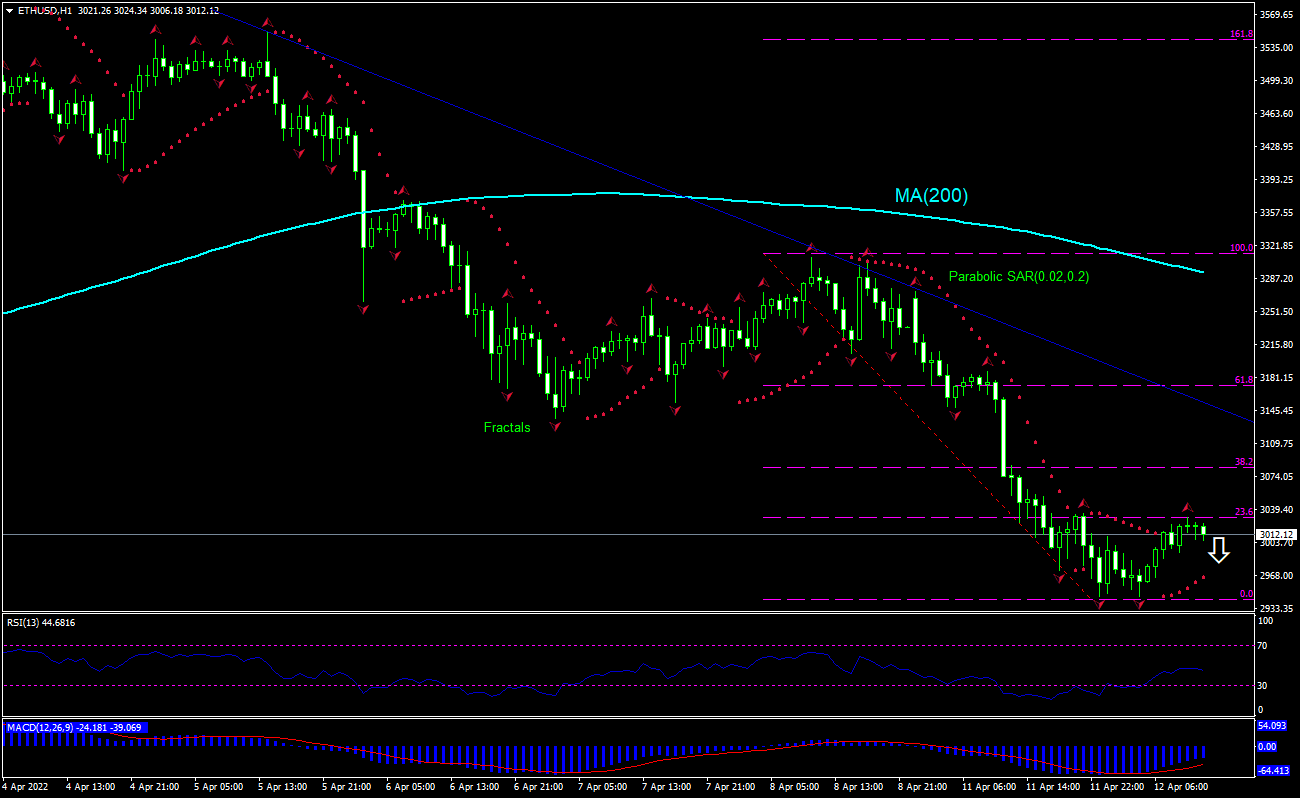
Ethereum / USD Technical Analysis
The ETHUSD technical analysis of the price chart on 1-hour timeframe shows ETHUSD: H1 is retreating under the 200-period moving average MA(200) following multiple tests of resistance line. We believe the bearish momentum will continue after the price breaches below 3005.02. A level below this can be used as an entry point for placing a pending order to sell. The stop loss can be placed above 3060.65. After placing the order, the stop loss is to be moved to the next fractal high indicator, following Parabolic signals. Thus, we are changing the expected profit/loss ratio to the breakeven point. If the price meets the stop loss level without reaching the order, we recommend cancelling the order: the market has undergone internal changes which were not taken into account.
Fundamental Analysis of CRYPTO - Ethereum / USD
Ethereum developers ran a test of a network upgrade that went well. Will the ETHUSD price reverse its retreating?
On Monday Ethereum developers began a test for an upgrade that would dramatically decrease the amount of energy used by the blockchain and make it eco-friendly. The test was a preparation for what’s called the “merge,” which aims to change dramatically how transactions are validated on the blockchain. Ethereum currently relies on proof of work, which requires that crypto miners complete complex calculations to validate transactions. This process consumes a huge amount of computer power and is often criticized due to its environmental impact. Under proof of stake, users would be able to validate transactions according to how many coins they contribute, or stake, to the network. In return for staking more coins, users will have a higher likelihood of being chosen to validate transactions on the network and earn a reward. After the real merge, Ethereum’s crypto mining would not involve high power consumption and the supply of new Ether would likely decline because fewer coins are expected to be issued. And institutional investment in the Ethereum network is expected to increase. An expected shift to proof of stake validation is deemed to be bullish for a cryptocurrency. However the current setup is bearish for ETHUSD.
Want to get more free analytics? Open Demo Account now to get daily news and analytical materials.
Author

Dmitry Lukashov
IFC Markets
Dimtry Lukashov is the senior analyst of IFC Markets. He started his professional career in the financial market as a trader interested in stocks and obligations.



