|

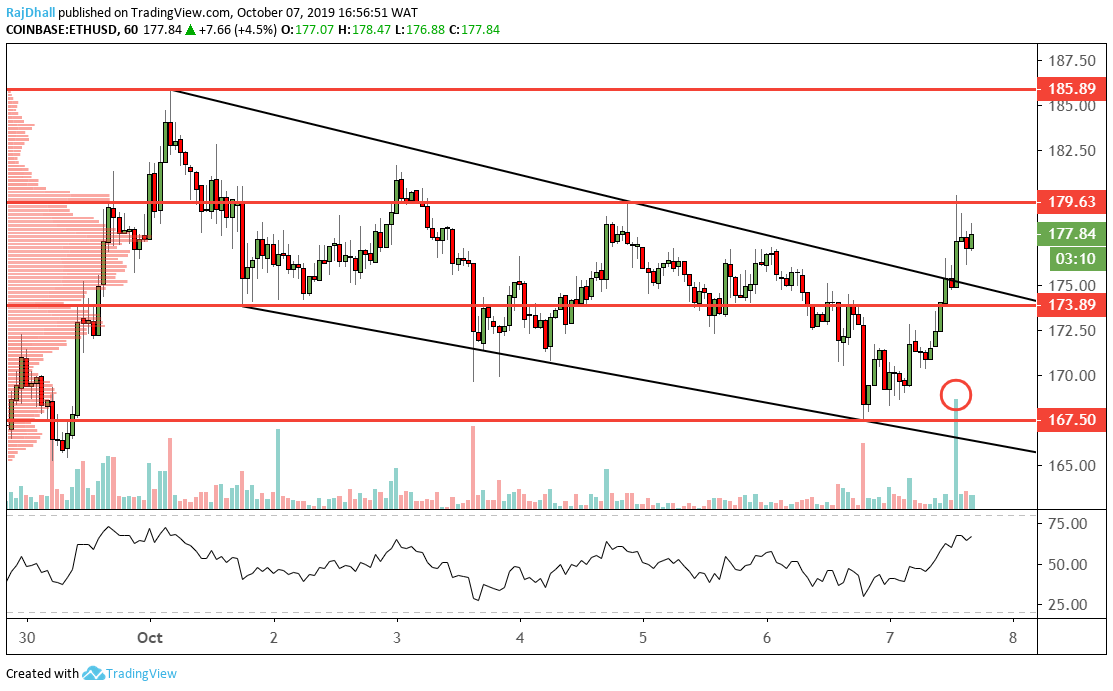
Ethereum technical analysis: Great technical breakout on decent volume

  • ETH/USD broke out the channel formation on the hourly chart.
  • Ethereum is now trading 4.50% higher as general crypto sentiment turns positive.

Ethereum has broken out of the channel formation on the hourly chart. The move was backed by good volume on the Coinbase exchange.

Now the 180.00 level is the resistance to beat but it has proved to be a difficult level in the past.

Right now price is resting at the value area. This is indicated by the bell curve on the left-hand side of the chart.

The relative strength indicator (RSI) has pushed to the highest level since the beginning of last month.

If we do get a retracement the market might look at the trendline it has just broken out of.

Ethereum Analysis

ETH/USD

Overview
Today last price178.03
Today Daily Change7.66
Today Daily Change %4.50
Today daily open170.37
 
Trends
Daily SMA20188.35
Daily SMA50 184.84
Daily SMA100213.5
Daily SMA200209.69
 
Levels
Previous Daily High177.2
Previous Daily Low168.1
Previous Weekly High186.07
Previous Weekly Low164.46
Previous Monthly High224.69
Previous Monthly Low152.51
Daily Fibonacci 38.2%171.58
Daily Fibonacci 61.8%173.73
Daily Pivot Point S1166.58
Daily Pivot Point S2162.78
Daily Pivot Point S3157.47
Daily Pivot Point R1175.68
Daily Pivot Point R2181
Daily Pivot Point R3184.79

Author

Rajan Dhall, MSTA

Rajan Dhall is an experienced market analyst, who has been trading professionally since 2007 managing various funds producing exceptional returns.

More from Rajan Dhall, MSTA
Share:

Editor's Picks

Ripple exposed to volatility amid low retail interest, modest fund inflows

Ripple (XRP) is extending its intraday decline to around $1.40 at the time of writing on Monday amid growing pressure from the retail market and risk-off sentiment that continues to keep investors on the sidelines.

Crypto Today: Bitcoin steadies around $70,000, Ethereum and XRP remain under pressure 

Bitcoin hovers around $70,000, up near 15% from last week's low of $60,000 despite low retail demand. Ethereum delicately holds $2,000 support as weak technicals weigh amid declining futures Open Interest.

Pi Network extends decline as steady mainnet migration adds pressure

PI edges lower by over 3% at press time on Monday, marking a third consecutive day of losses. The declining trend in PI aligns with the steady mainnet migration of PI tokens, which may fuel selling pressure. The technical outlook for PI remains bearish, with bearish momentum persisting. 

Bitcoin slips below $70,000 as ETF outflows, realized losses fuel bearish outlook

Bitcoin price trades in red below $70,000 on Monday after correcting nearly 9% in the previous week. US-listed spot ETFs recorded a $318 million weekly outflow, marking the third consecutive week of withdrawals.

Bitcoin Price Annual Forecast: BTC holds long-term bullish structure heading into 2026

Bitcoin (BTC) is wrapping up 2025 as one of its most eventful years, defined by unprecedented institutional participation, major regulatory developments, and extreme price volatility.

Bitcoin: The worst may be behind us

Bitcoin (BTC) price recovers slightly, trading at $65,000 at the time of writing on Friday, after reaching a low of $60,000 during the early Asian trading session. The Crypto King remained under pressure so far this week, posting three consecutive weeks of losses exceeding 30%.