Ethereum technical analysis: ETH/USD vulnerabilities still largely point to the downside
- Ethereum price is trading in the green, up % the session on
- ETH/USD downside momentum continues with the price running at its fourth consecutive week in the red.
- The next major demand zone is seen down at psychological $100 price mark.

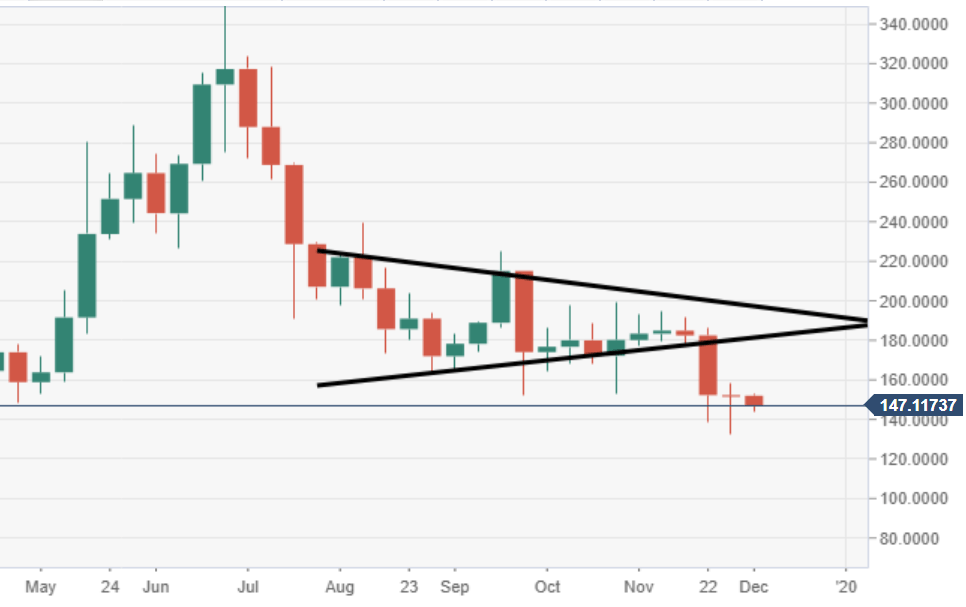
ETH/USD weekly chart
Price action continues to extend to the downside, since a weekly breach of a bearish pennant structure.
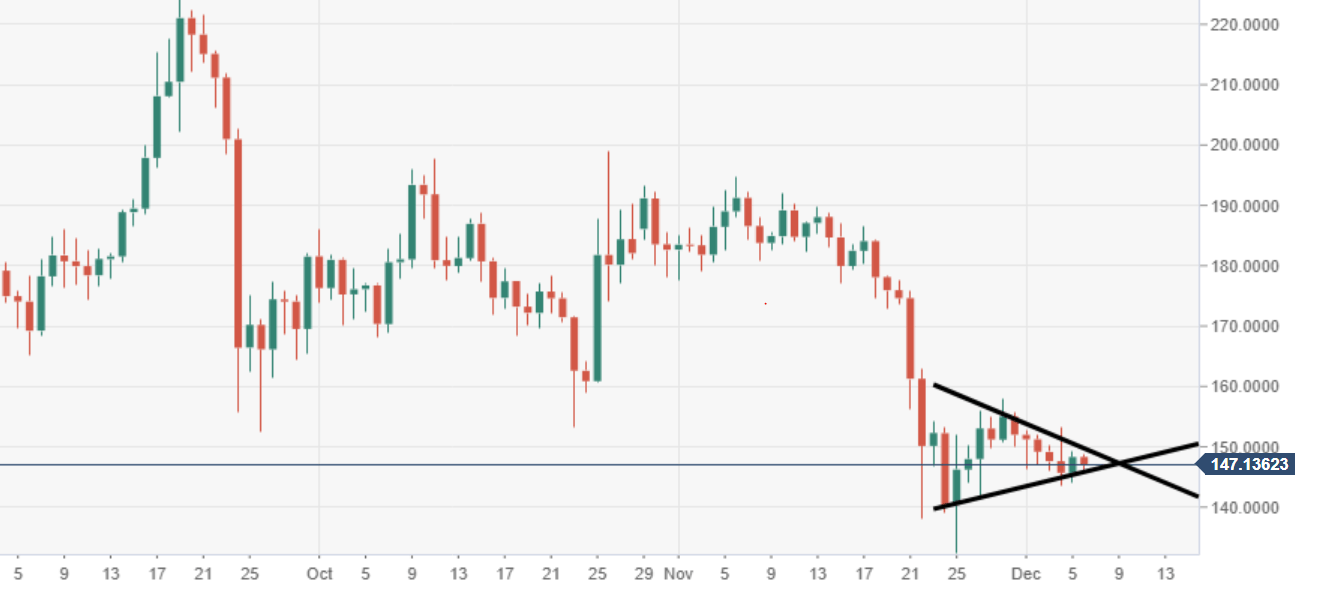
ETH/USD daily chart
Daily price action is moving within a bearish pennant structure, subject to a potential breakout south.
Spot rate: 147.11
Relative change: -0.80%
High: 148.78
Low: 146.08
Author

Ken Chigbo
Independent Analyst
Ken has over 8 years exposure to the financial markets. He started his career as an analyst, covering a variety of asset classes; forex, fixed income, commodities and equities.
More from Ken Chigbo


