|

Ethereum Technical Analysis: ETH/USD rising channel technical set up

  • Ethereum price was seen in the green on Wednesday, trading up some 0.55%.
  • ETH/USD is moving within an ascending channel formation, subject to a potential break lower. 
  • Chunky buying was seen from the back-end of Tuesday at the big $200 area. 

ETH/USD 60-minute chart 
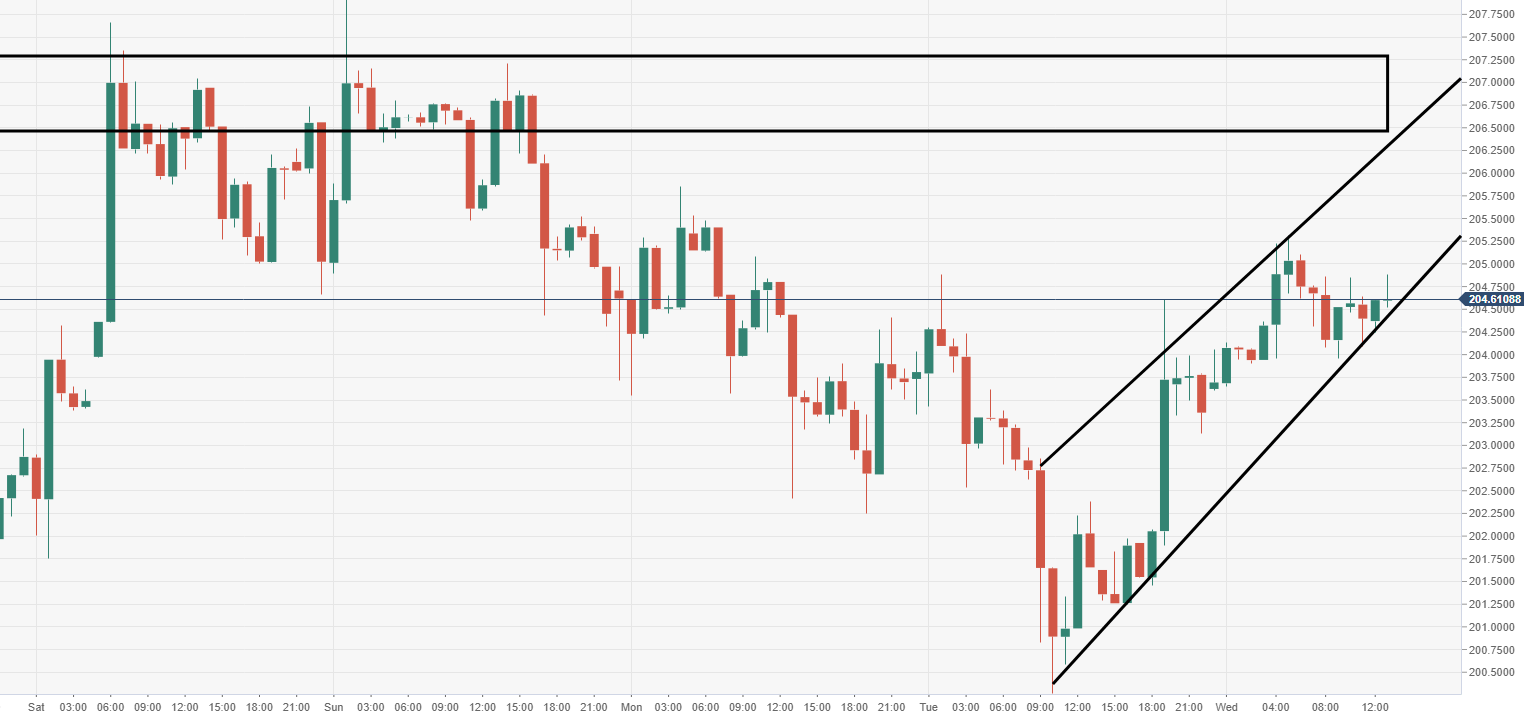


Spot rate:                  204.63

Relative change:      +0.55%

High:                         205.30

Low:                          203.92

Trend:                       Neutral

Support 1:                 204.40, ascending channel.

Support 2:                 202.25, support on 60-minute.

Support 3:                 200.00, chunky demand zone. 

Resistance 1:            205.20, resistance on 60-minute. 

Resistance 2:            206.12, upper part of channel.

Resistance 3:            207.00, supply zone. 

Author

Ken Chigbo

Ken Chigbo

Independent Analyst

Ken has over 8 years exposure to the financial markets. He started his career as an analyst, covering a variety of asset classes; forex, fixed income, commodities and equities.

More from Ken Chigbo
Share:

Editor's Picks

Ripple exposed to volatility amid low retail interest, modest fund inflows

Ripple (XRP) is extending its intraday decline to around $1.40 at the time of writing on Monday amid growing pressure from the retail market and risk-off sentiment that continues to keep investors on the sidelines.

Crypto Today: Bitcoin steadies around $70,000, Ethereum and XRP remain under pressure 

Bitcoin hovers around $70,000, up near 15% from last week's low of $60,000 despite low retail demand. Ethereum delicately holds $2,000 support as weak technicals weigh amid declining futures Open Interest.

Pi Network extends decline as steady mainnet migration adds pressure

PI edges lower by over 3% at press time on Monday, marking a third consecutive day of losses. The declining trend in PI aligns with the steady mainnet migration of PI tokens, which may fuel selling pressure. The technical outlook for PI remains bearish, with bearish momentum persisting. 

Bitcoin slips below $70,000 as ETF outflows, realized losses fuel bearish outlook

Bitcoin price trades in red below $70,000 on Monday after correcting nearly 9% in the previous week. US-listed spot ETFs recorded a $318 million weekly outflow, marking the third consecutive week of withdrawals.

Bitcoin Price Annual Forecast: BTC holds long-term bullish structure heading into 2026

Bitcoin (BTC) is wrapping up 2025 as one of its most eventful years, defined by unprecedented institutional participation, major regulatory developments, and extreme price volatility.

Bitcoin: The worst may be behind us

Bitcoin (BTC) price recovers slightly, trading at $65,000 at the time of writing on Friday, after reaching a low of $60,000 during the early Asian trading session. The Crypto King remained under pressure so far this week, posting three consecutive weeks of losses exceeding 30%.