|

Ethereum Technical Analysis: ETH/USD heading into a pivotal trend defining zone

  • Ethereum price on Friday is trading in negative territory, nursing losses of some 0.30%. 
  • ETH/USD price action has completed a breakout and is set for a big retest of a descending wedge pattern formation. 
  • Fidelity recently noted that they are holding off on Ethereum support for now, due to the hard fork upgrades.  

Spot rate:                 137.40

Relative change:      -0.37%

High:                         141.27

Low:                          136.21

Trends:
    Daily SMA20: 138.86
    Daily SMA50: 124.51
    Daily SMA100: 121.85
    Daily SMA200: 169.74
Levels:
    Previous Daily High: 141.28
    Previous Daily Low: 136.21
    Previous Weekly High: 167.77
    Previous Weekly Low: 127.73
    Previous Monthly High: 167.77
    Previous Monthly Low: 101.12
    Daily Fibonacci 38.2%: 138.15
    Daily Fibonacci 61.8%: 139.34
    Daily Pivot Point S1: 135.4
    Daily Pivot Point S2: 133.27
    Daily Pivot Point S3: 130.34
    Daily Pivot Point R1: 140.47
    Daily Pivot Point R2: 143.41
    Daily Pivot Point R3: 145.54

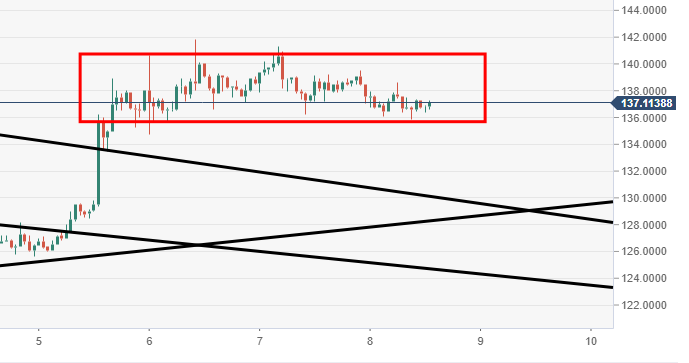
ETH/USD 60-minute chart

  • Price action via the near-term 60-minute view is range-bound, losing ground to the upside. 
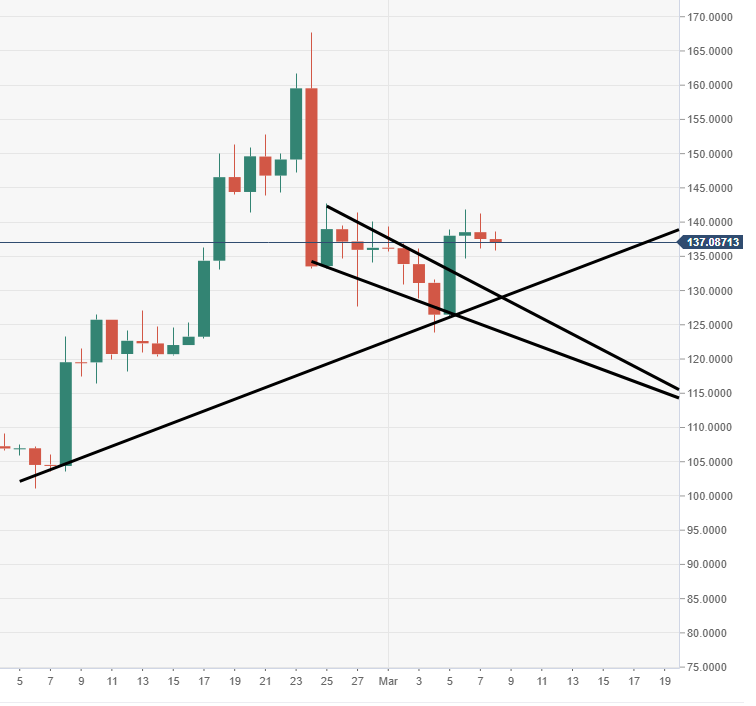
ETH/USD daily chart

  • ETH/USD edging back towards safety as seen via the daily time frame, the price has broken out from a wedge and is now going for the retest. 

Author

Ken Chigbo

Ken Chigbo

Independent Analyst

Ken has over 8 years exposure to the financial markets. He started his career as an analyst, covering a variety of asset classes; forex, fixed income, commodities and equities.

More from Ken Chigbo
Share:

Editor's Picks

Crypto Today: Bitcoin, Ethereum, XRP trade under sustained selling pressure despite mild ETF inflows

Cryptocurrency prices remain under pressure as a risk-off mood persists on Friday, with Bitcoin consolidating its losses above $62,000. Altcoins, including Ethereum and Ripple, are extending their weakness, trading near lower support levels around $1,600 and $1.12, respectively.

Bitcoin Weekly Forecast: After the bloodbath, everyone looks at $60,000

Bitcoin (BTC) hovers above $62,000 at the time of writing on Friday, weighed down by growing risk-off sentiment due to persistent geopolitical tensions in the Middle East and sticky macroeconomic uncertainty.

Cardano hits five-year low even as Hoskinson clarifies "break" isn't an exit

Cardano price is down 10% at press time on Friday, extending losses over 30% so far this week amid Charles Hoskinson's clarification that "break" isn't an exit. A reactionary spike in on-chain activity and social chatter, reflecting a strength of community, but fails to absorb the price decline.

Arthur Hayes' “Holy Trinity” is dead: Exits Zcash after Orchard Pool exploit

Arthur Hayes dumped his entire Zcash holdings on Friday, a day after selling his HYPE and NEAR holdings. Zcash is down 13% so far on Friday, extending the 26% drop from the previous day.

Billions in ETF outflows don’t bode well
Bitcoin (BTC) remains under pressure, trading below $74,000 on Friday, and is set to post its third consecutive week of losses. The institutional sell-off continues, with spot BTC Exchange-Traded funds (ETFs) recording billions in outflows. In addition, sticky inflation and macroeconomic headwinds suppress the Crypto King’s upside potential. Institutional demand continues to weaken so far this week.