Ethereum Technical Analysis: ETH/USD bulls breakout to the upside from a pennant set up
- Ethereum price holding decent gains of 4% in the session on Wednesday.
- ETH/USD bulls further capitalizing after moving back above the $100 mark.
- Pennant pattern was breached to the upside by the market bulls, extending move to the north.

ETH/USD 15-minute chart
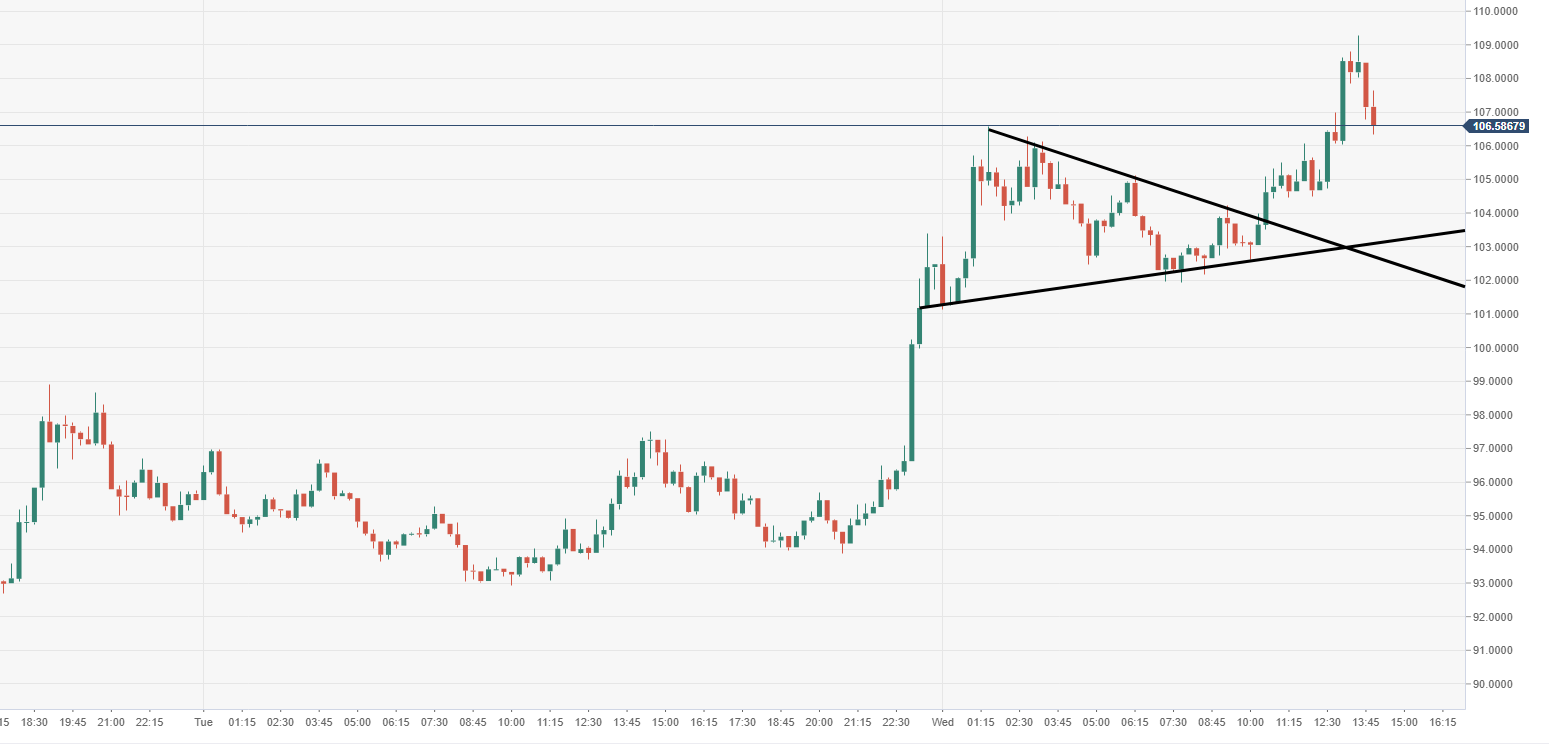
Spot rate: 106.51
Relative change: +4.12%
High: 109.29
Low: 101.14
Trend: Bullish
Resistance 1: 106.26, daily pivot point resistance.
Resistance 2: 110.04, daily pivot point resistance.
Resistance 3: 116.70, daily pivot point resistance.
Support 1: 95.82, daily pivot point support.
Support 2: 89.16, daily pivot point support.
Support 3: 85.38, daily pivot point support.
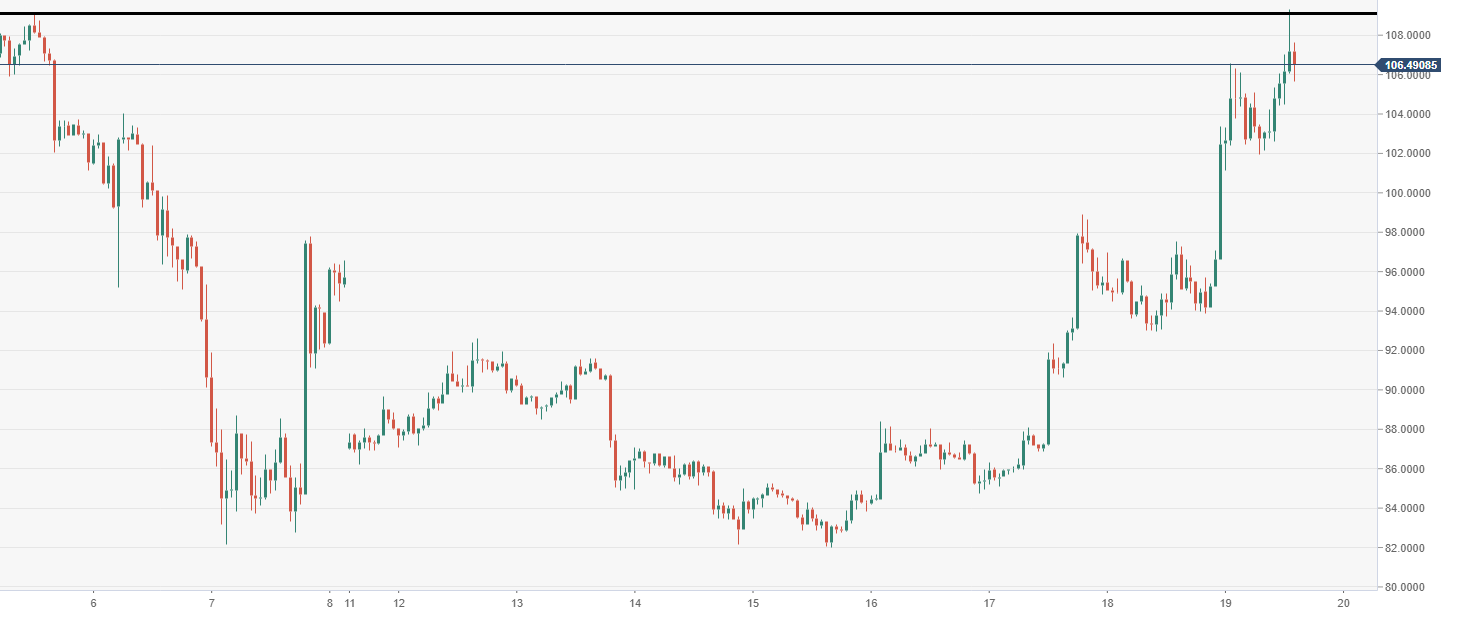
ETH/USD 60-minute chart
- Minor resistance seen at resistance seen during consolidation area of 5th December drop.
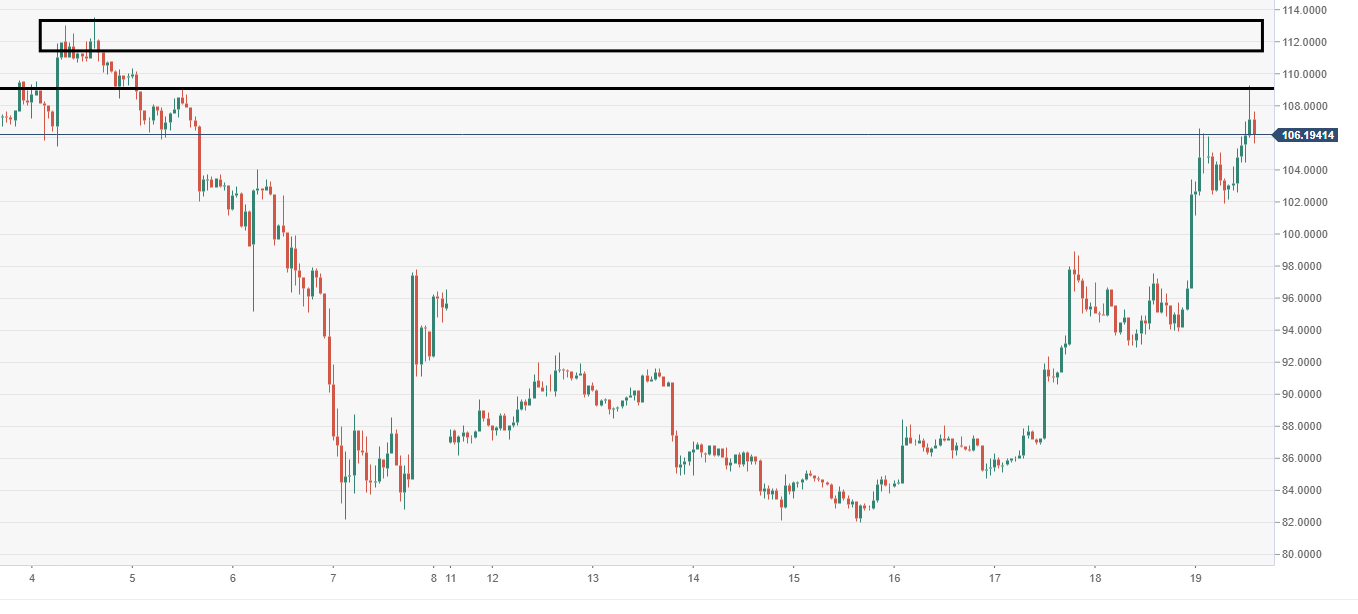
ETH/USD 4-hour chart
- Next major resistance can be eyed at supply tracking form $112-114.
Author

Ken Chigbo
Independent Analyst
Ken has over 8 years exposure to the financial markets. He started his career as an analyst, covering a variety of asset classes; forex, fixed income, commodities and equities.


