- Ethereum is seen down in the session by some 3.5%, as a further cooling is observed across the market on Friday.
- ETH/USD has formed a bullish flag pattern via the 60-minute chart view.
- Price bouncing lower for now, with what can also be viewed as a descending channel formation.
- There is potential room for a decent breakout to the upside, should momentum be picked back up.
ETH/USD 60-minute chart
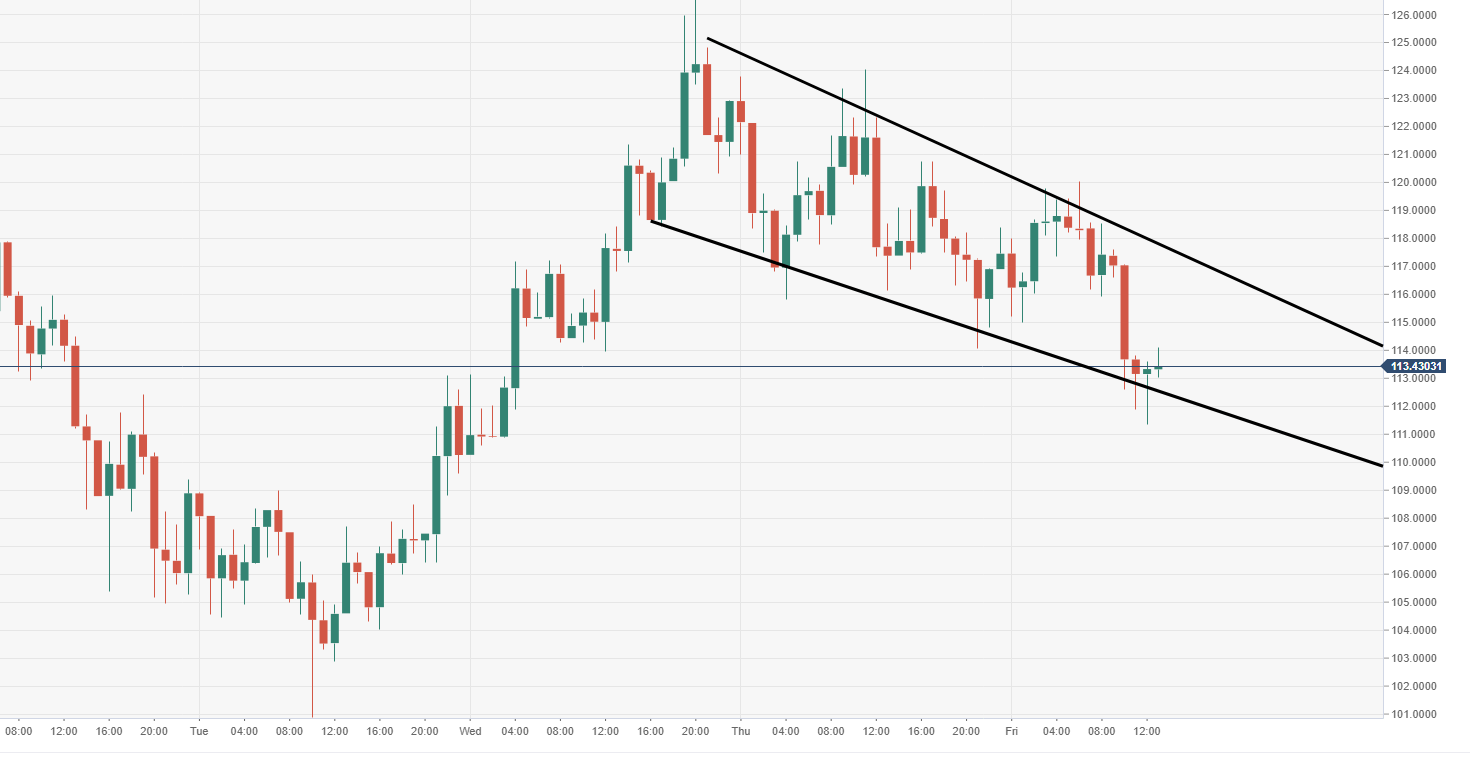
Spot rate: 113.50
Relative change: -3.41%
High: 120.01
Low: 111.40
Trend: Bearish
Support 1: 113.00, ascending trend line.
Support 2: 112.65, lower part of channel.
Support 3: 108.56, daily pivot point support.
Resistance 1: 117.65, upper part of channel.
Resistance 2: 122.97, daily pivot point resistance.
Resistance 3: 128.48, daily pivot point resistance.
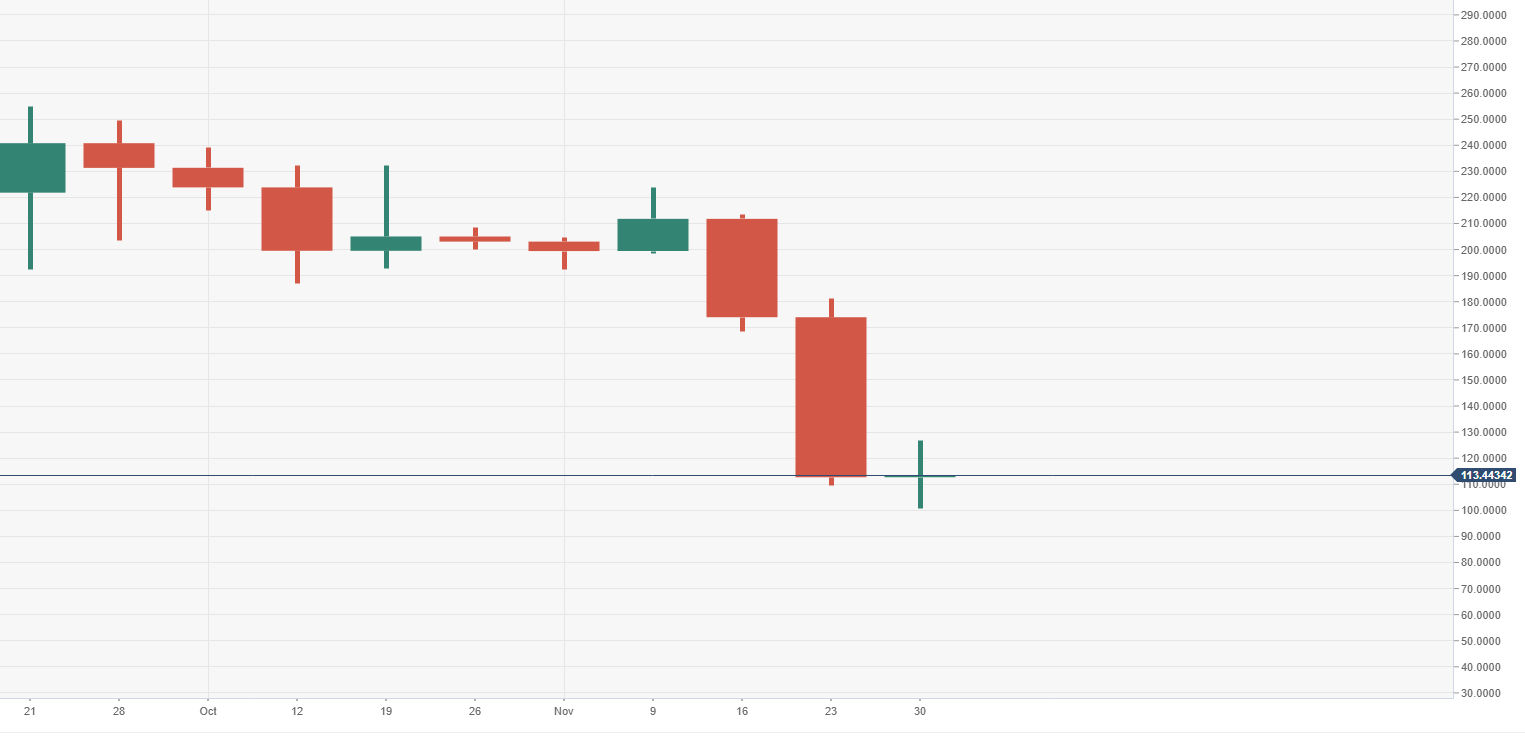
ETH/USD weekly chart
- ETH/USD battling it out to avoid another weekly loss, after the previous two recorded negative closes.
Information on these pages contains forward-looking statements that involve risks and uncertainties. Markets and instruments profiled on this page are for informational purposes only and should not in any way come across as a recommendation to buy or sell in these assets. You should do your own thorough research before making any investment decisions. FXStreet does not in any way guarantee that this information is free from mistakes, errors, or material misstatements. It also does not guarantee that this information is of a timely nature. Investing in Open Markets involves a great deal of risk, including the loss of all or a portion of your investment, as well as emotional distress. All risks, losses and costs associated with investing, including total loss of principal, are your responsibility. The views and opinions expressed in this article are those of the authors and do not necessarily reflect the official policy or position of FXStreet nor its advertisers.
Latest Crypto News & Analysis
Editors’ Picks
Bitcoin ready for bullish continuation as crypto bull cycle pauses
The cryptocurrency market has taken a hiatus after a gruesome week of overbearing declines. Bitcoin failed to break the resistance at $52,000 but headed south, resting the support at $45,000.
XLM on the brink of a 45% collapse, shows technicals
Stellar price already had a significant 50% sell-off from its top of $0.60 but the bears could be eying up even more. There is a lot of downside potential for XLM as several indicators show it could be poised for another leg up.
LTC whales go into a buying spree, eying up $260
Litecoin price remains bounded inside an ascending parallel channel on the 12-hour chart after a significant sell-off from $247 down to $157. It seems that LTC whales have taken advantage of the recent dip to buy even more.
DEXTF Protocol launches incentivization program on SushiSwap offering 376% APY
DeFi users will be able to generate massive returns as the SushiSwap Onsen protocol is about to offer a new incentivization program developed by DEXTF Protocol.
Bitcoin Weekly Forecast: BTC journey to $100,000 might be easier than expected
This past week has been extremely beneficial for Bitcoin which jumped by 30% since Monday 8. Several positive announcements, especially Tesla purchasing $1.5 billion worth of the digital asset propelled the flagship cryptocurrency to new highs.