Ethereum price prepares for a year-end Santa Claus rally as bulls target $750
- Ethereum price is contained inside an ascending triangle pattern on the 4-hour chart.
- We are a few weeks away from a potential Santa Claus rally by the end of this year.

Ethereum price has rebounded significantly during the weekend from a low price of $543 to a peak of $595. It seems that bulls maintain control and gear up for a possible Santa Claus rally by the end of 2020.
This type of rally involves a rise in an asset during the last five days of December and the next two days of January. This phenomenon was first recorded in 1972 by Yale Hirsch, the founder of the Hirsch Organization and creator of the Stock Trader's Almanac. According to recent statistics, the stock market has risen about 1.3% on average during these seven days.
Can Ethereum price really benefit from a Santa rally?
According to past price history, Ethereum price increased by 11% from December 25 until December 29, 2019, but lost almost all gains by January 2, 2020. Back to December 25, 2018, the digital asset saw a massive 21% rise until January 2, 2019.
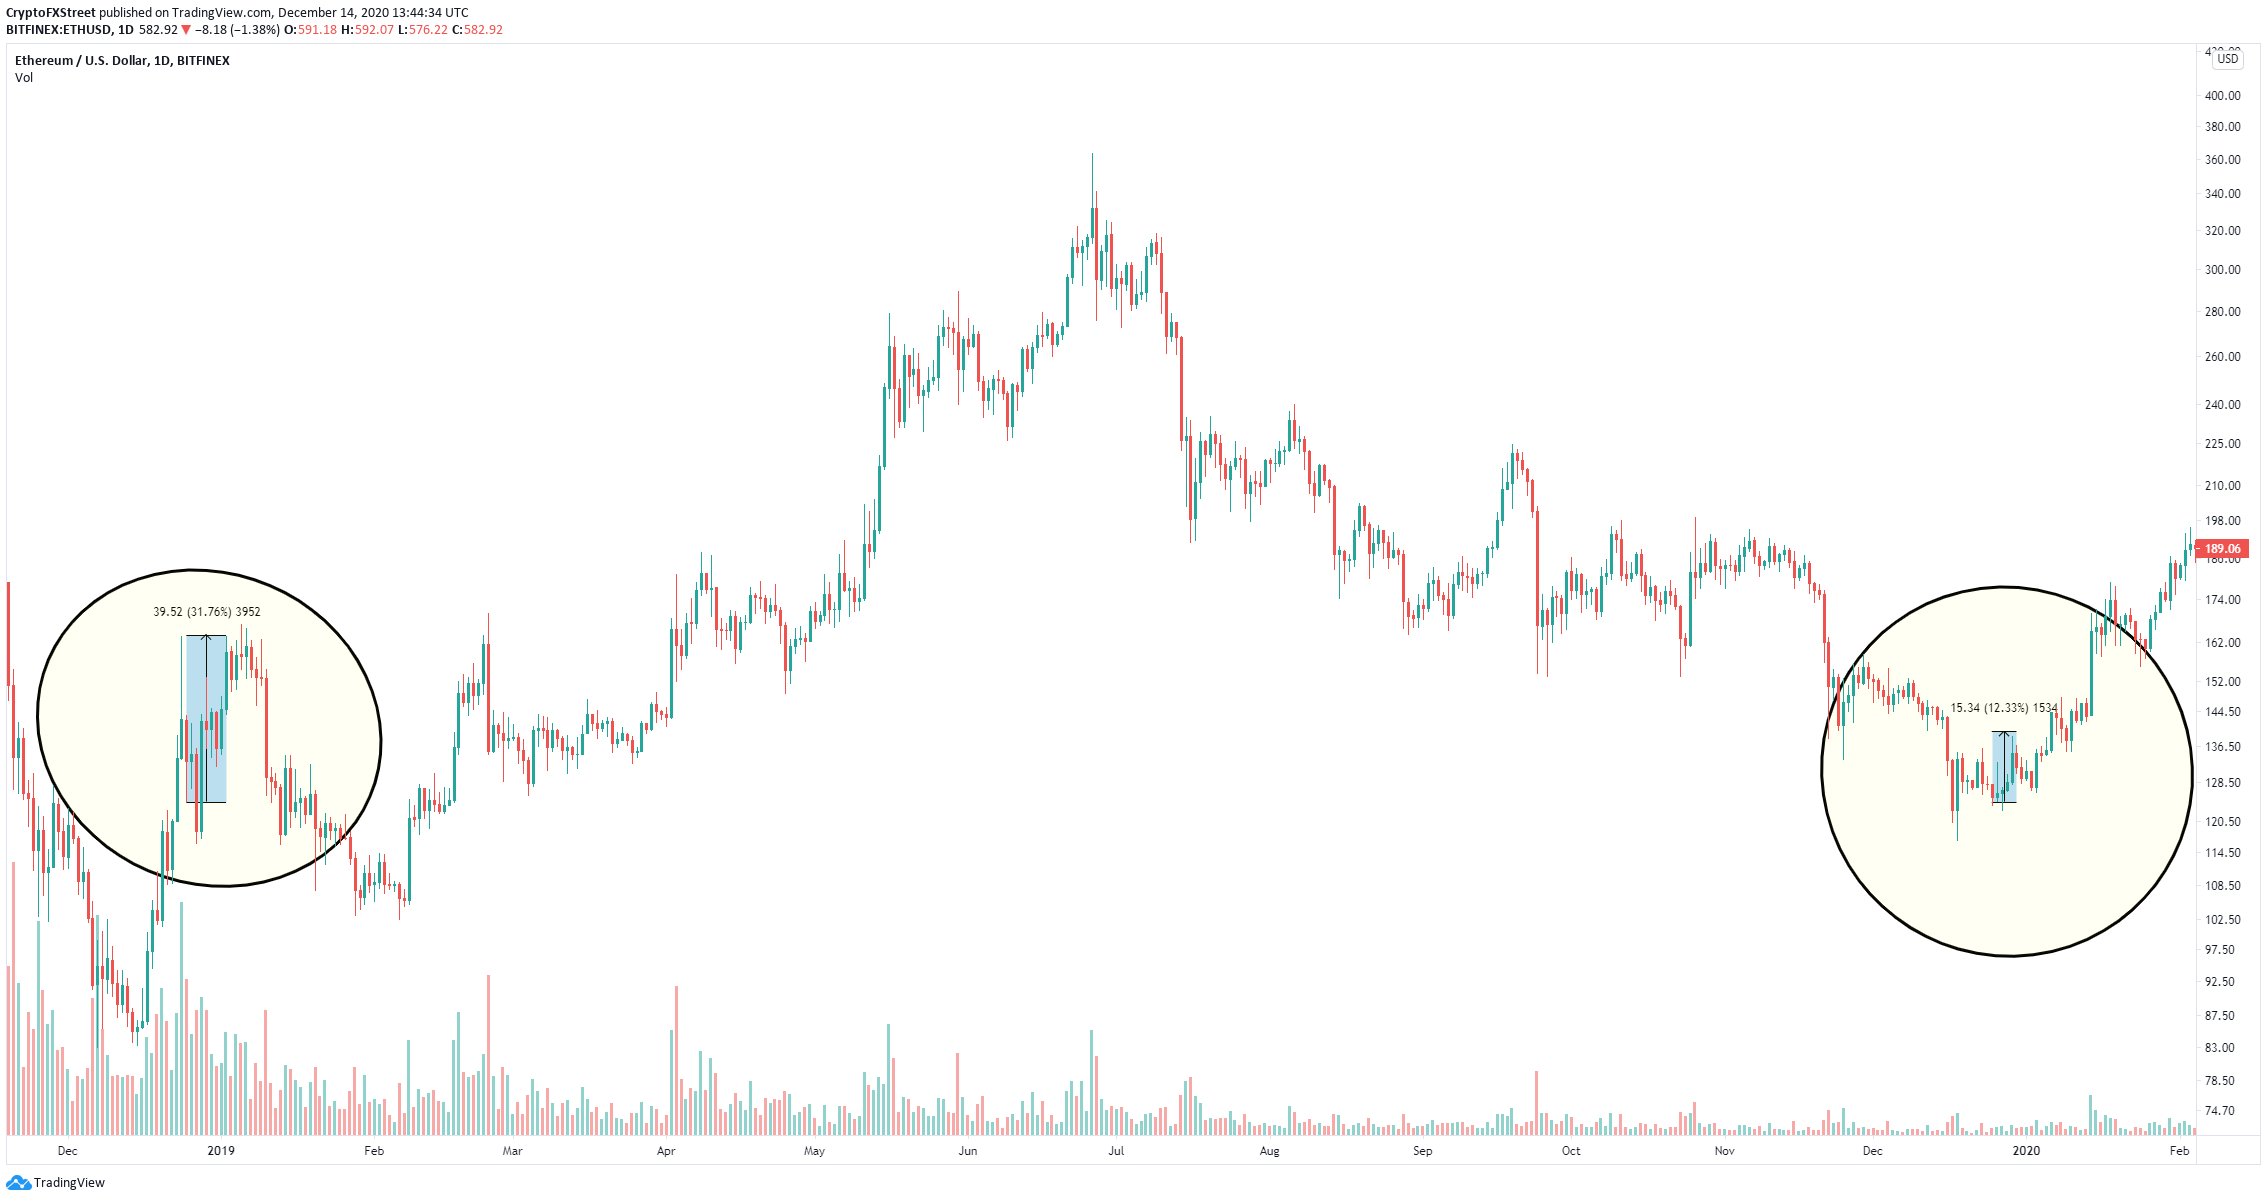
ETH/USD daily chart
Ethereum definitely seems to benefit from the last few days of December, which means we are about ten days from a possible mini-rally. On the 4-hour chart, the digital asset has established an ascending triangle pattern.
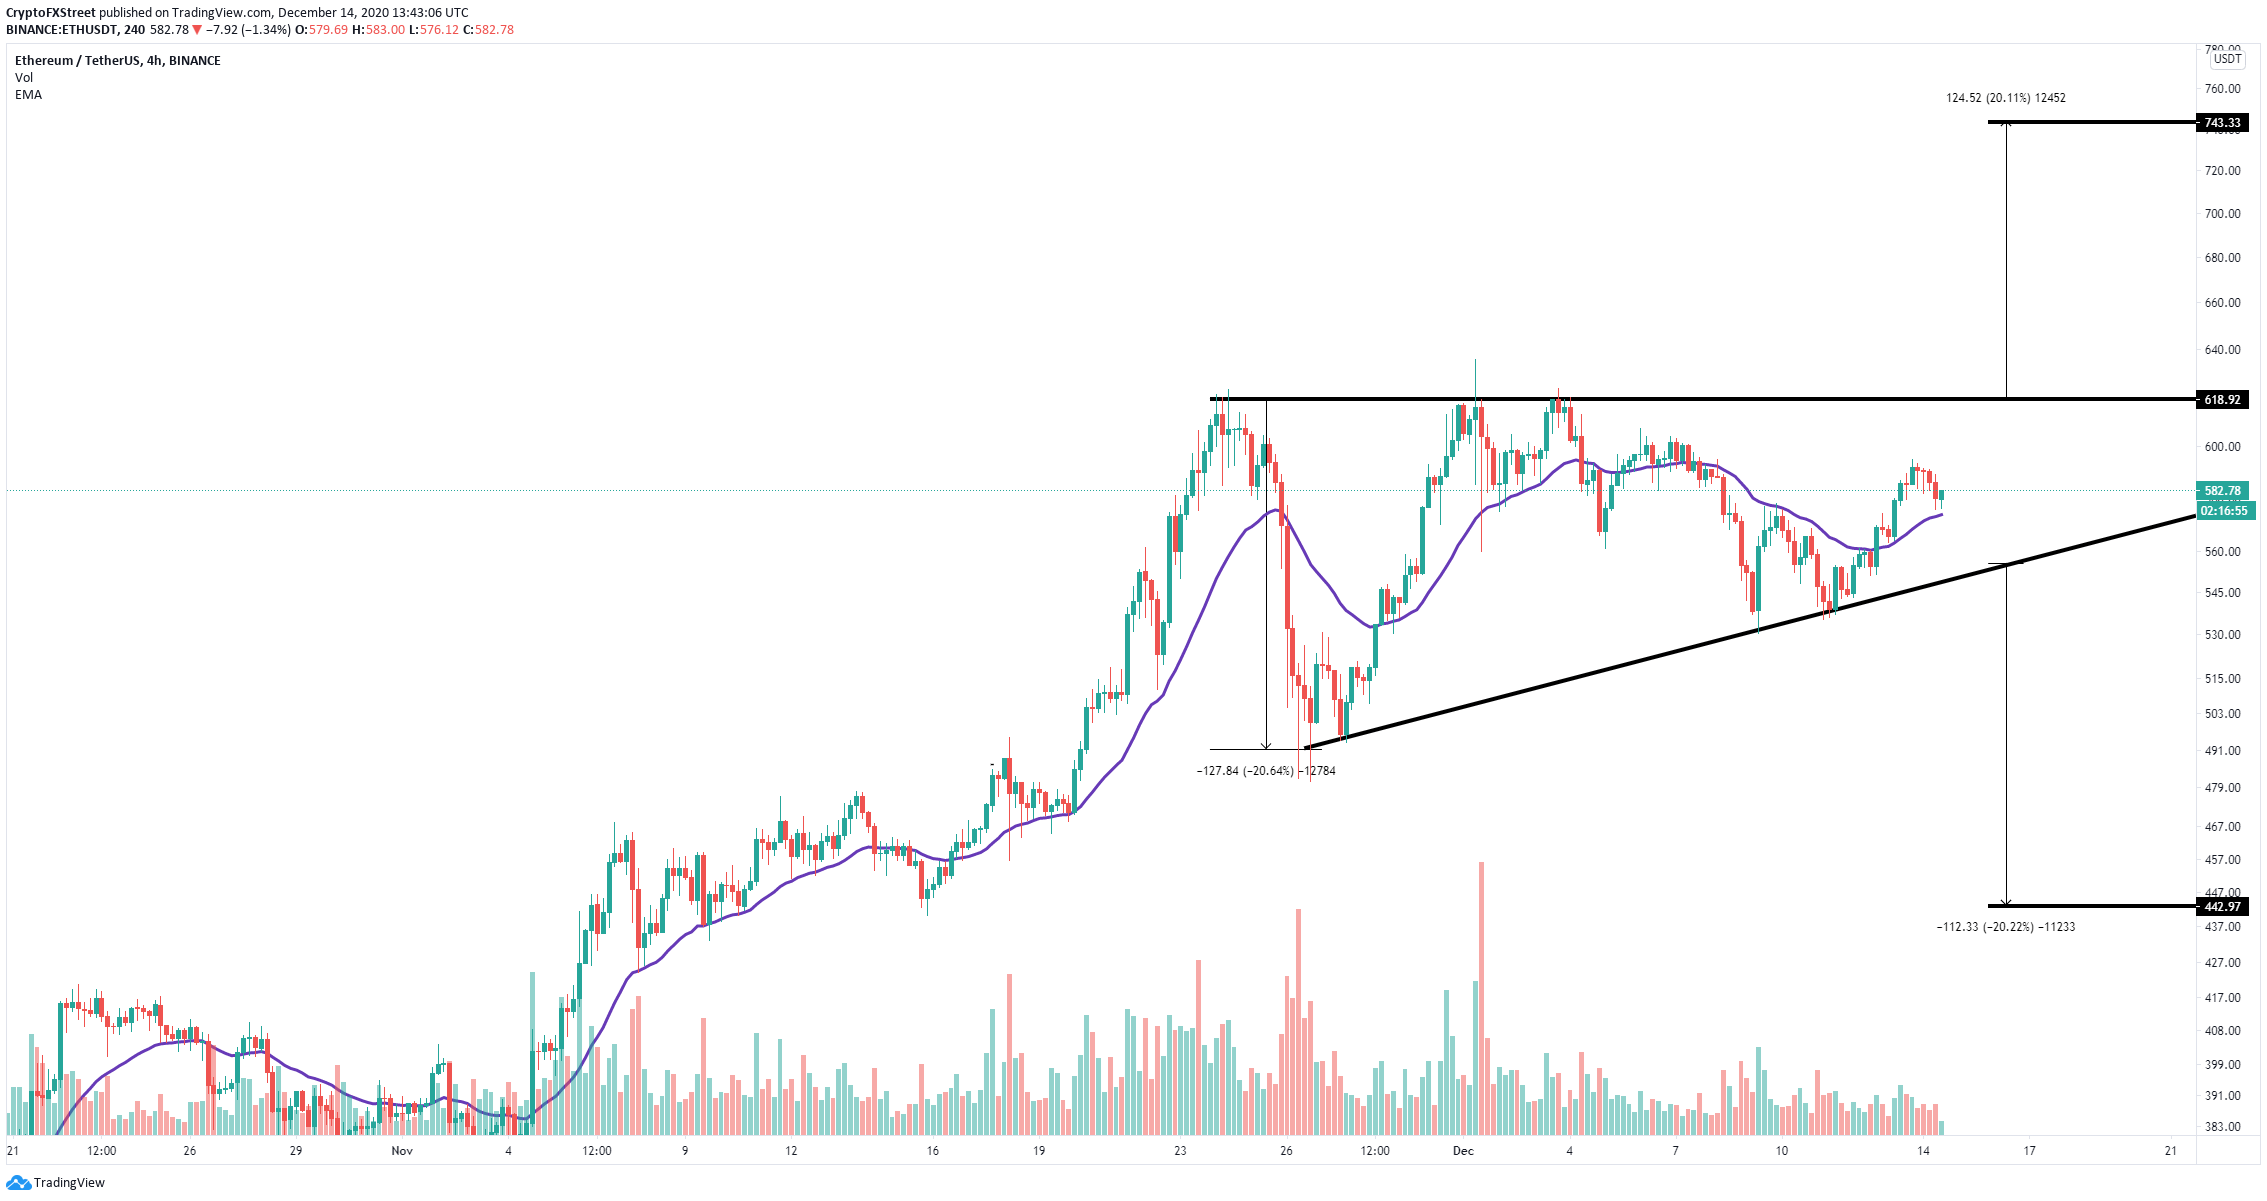
ETH/USD 4-hour chart
So far, bulls have defended the 26-EMA, which has served as a support guide in the past. A bounce from this level at $572 can easily drive Ethereum price towards the top of the pattern at $619. A breakout above this point would push ETH to a high of $743.
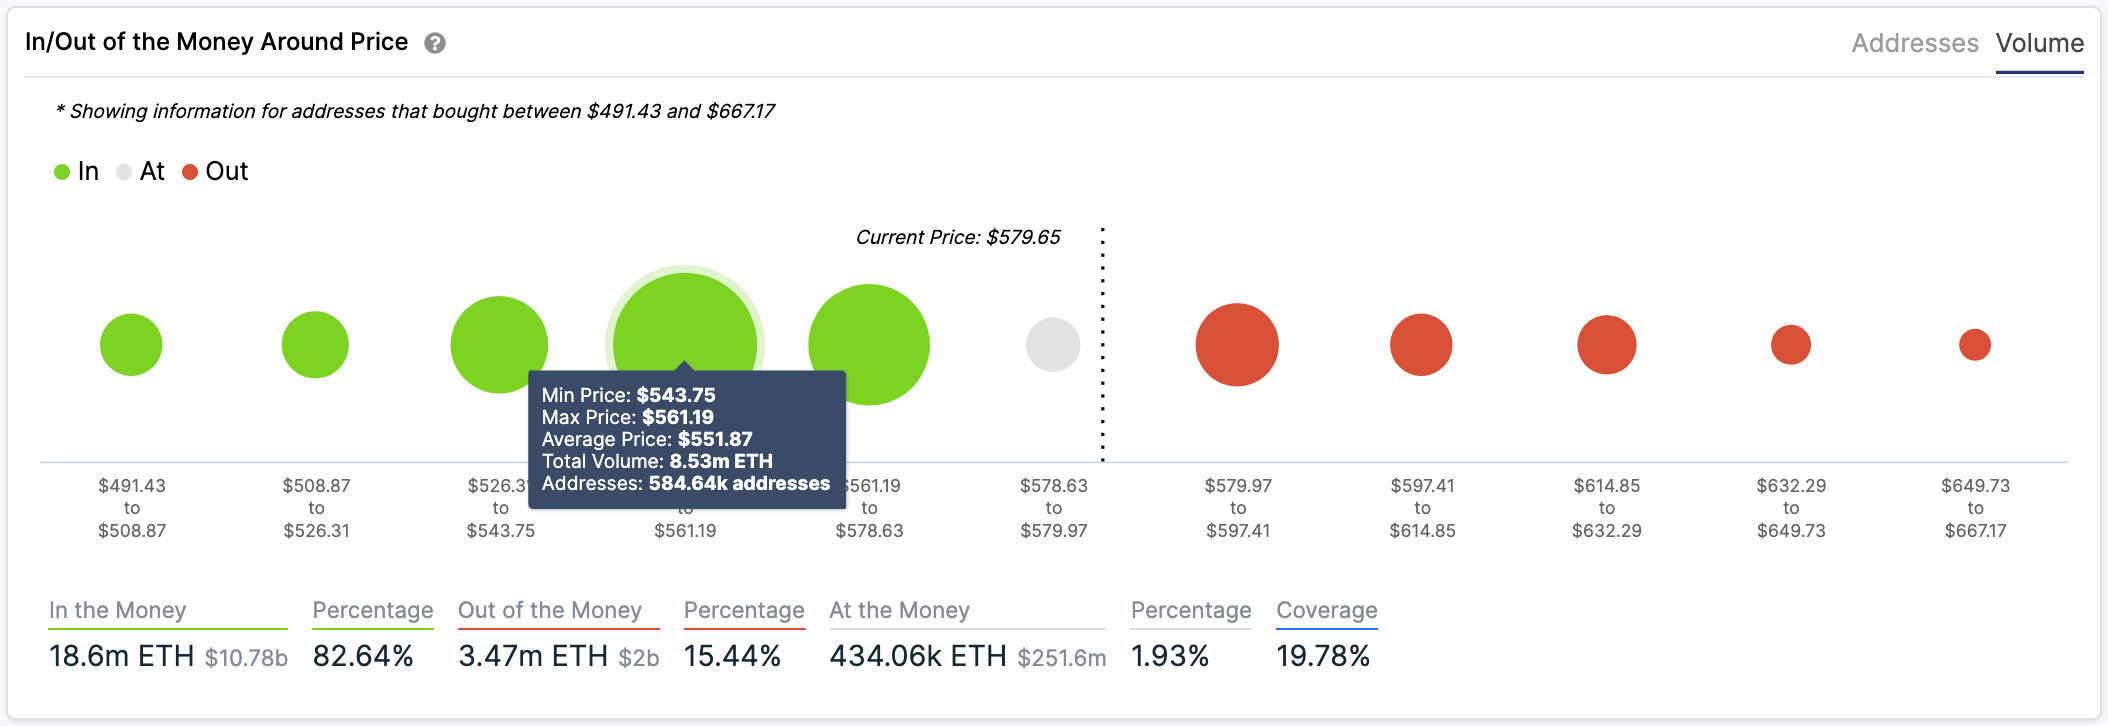
ETH IOMAP chart
According to the In/Out of the Money Around Price (IOMAP) chart, there is a lot of support on the way down below $580 but feeble resistance ahead, which favors the bulls as they face practically no opposition until $670.
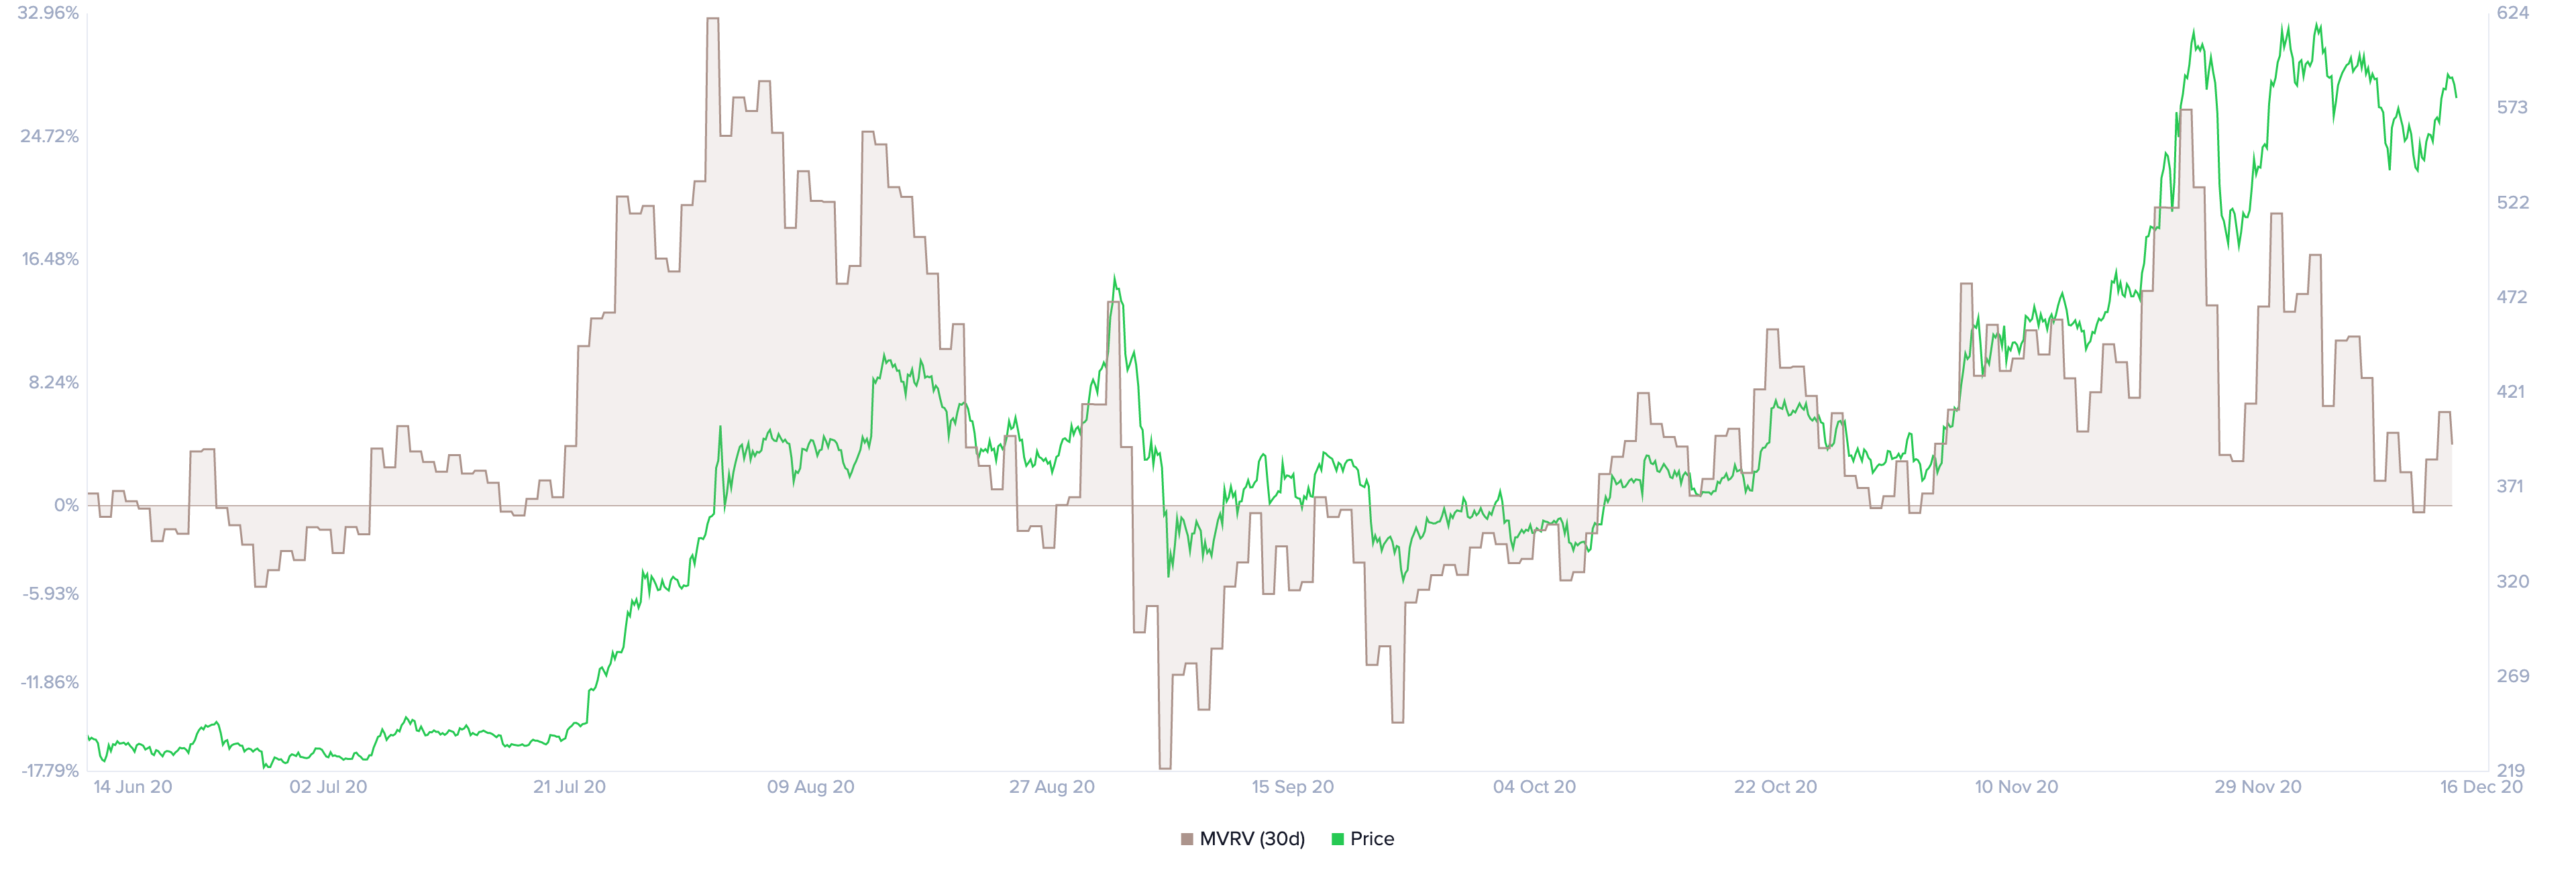
ETH MVRV chart
Other on-chain metrics also give the bulls better odds in the short-term. The MVRV ratio has recently touched the buy zone, which is usually an accurate indicator for future investors looking to get into an asset.
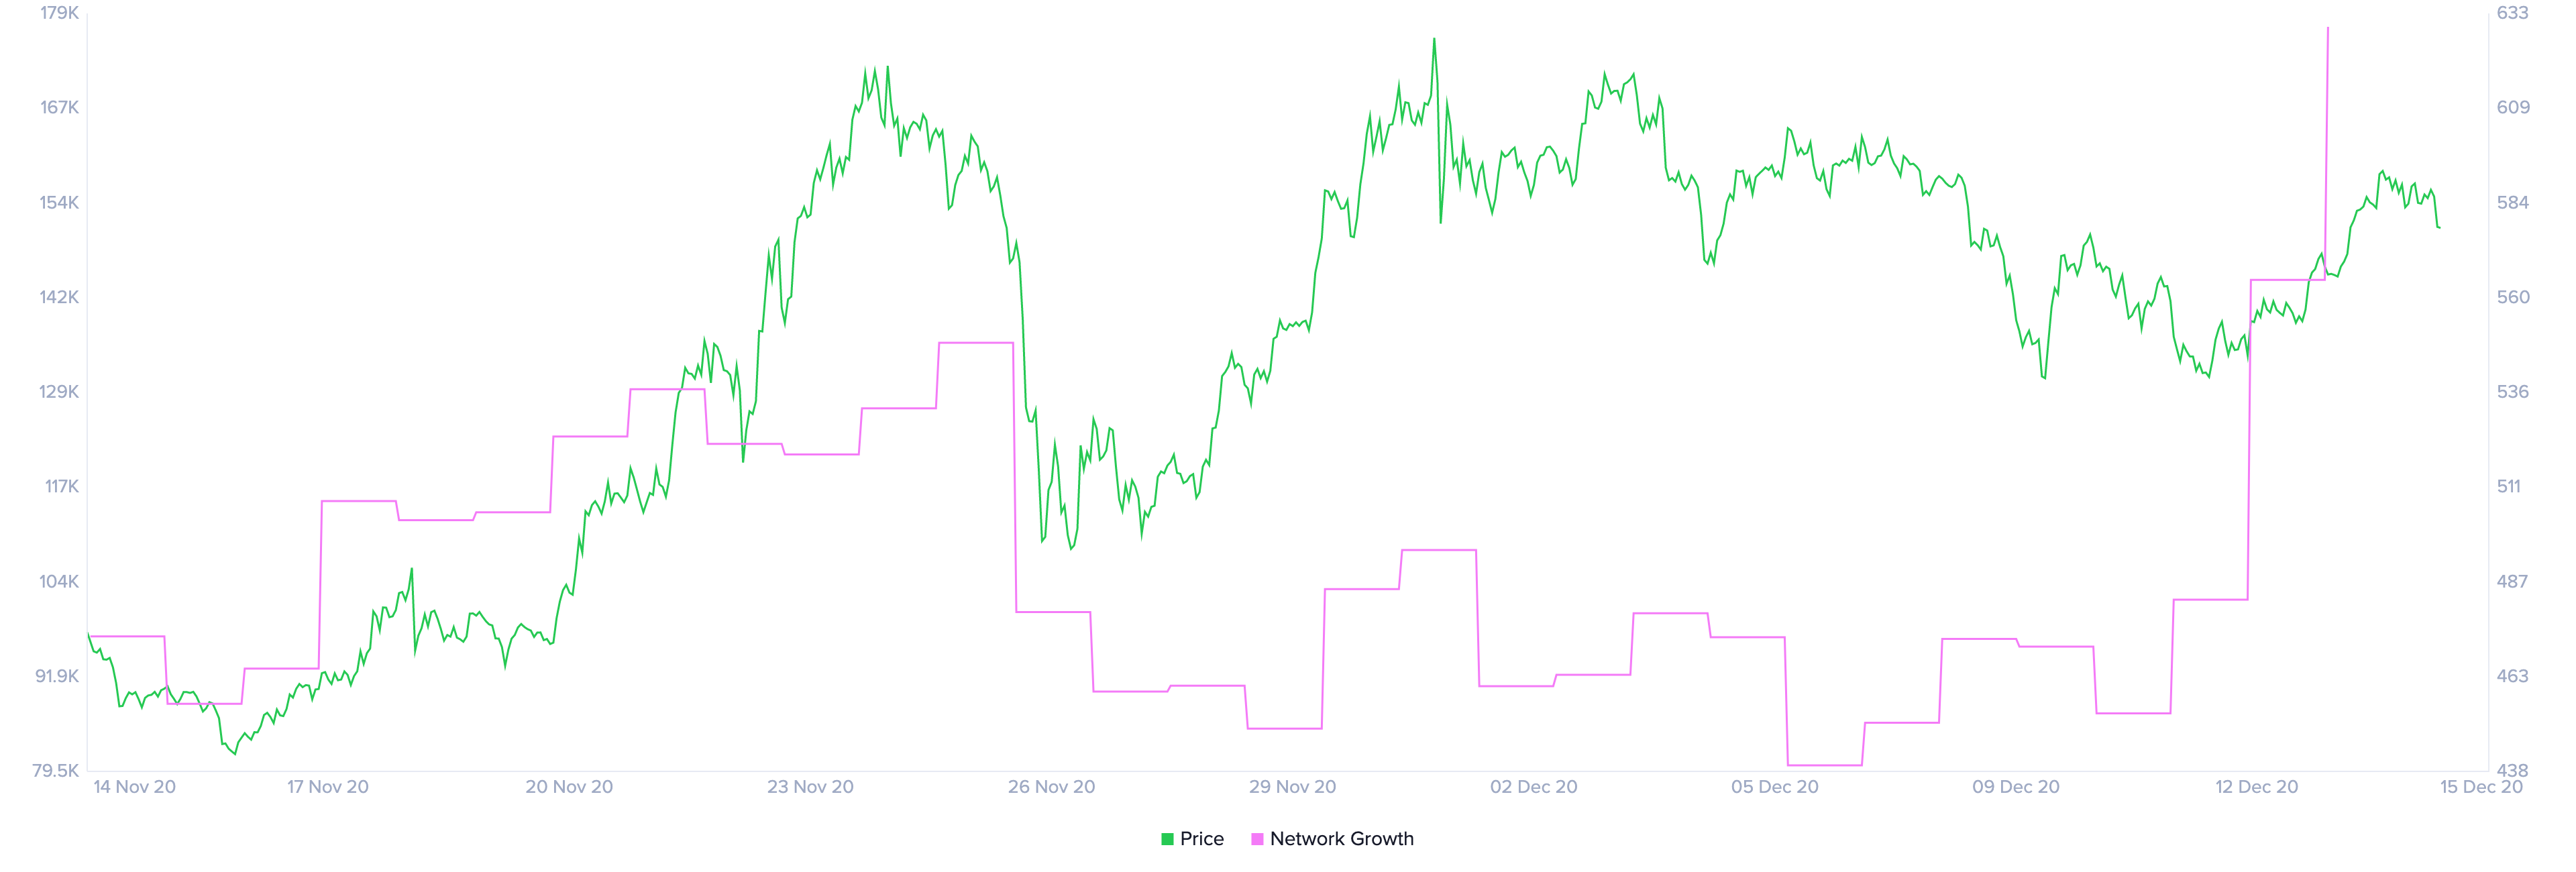
ETH Network Growth chart
Additionally, the number of Ethereum coins locked inside the Eth2 deposit contract continues rising at 1,468,513, representing 1.3% of the total supply. Furthermore, the digital asset has also experienced a significant spike in its network growth, which indicates new investors are highly interested in it.
However, despite all the bullish factors in favor of Ethereum, a breakdown below the support trendline of the ascending triangle pattern at $550 would drive Ethereum price towards a low of $442.
Author

Lorenzo Stroe
Independent Analyst
Lorenzo is an experienced Technical Analyst and Content Writer who has been working in the cryptocurrency industry since 2012. He also has a passion for trading.


