- ETH bulls gear up for a fresh leg higher.
- Falling wedge breakout confirmed on the 4H chart.
- RSI stays bullish, a test of the $600 mark inevitable.
ETH/USD is building onto Saturday’s recovery, as the bulls look to regain the $600 threshold amid a favorable technical setup on the four-hour chart.
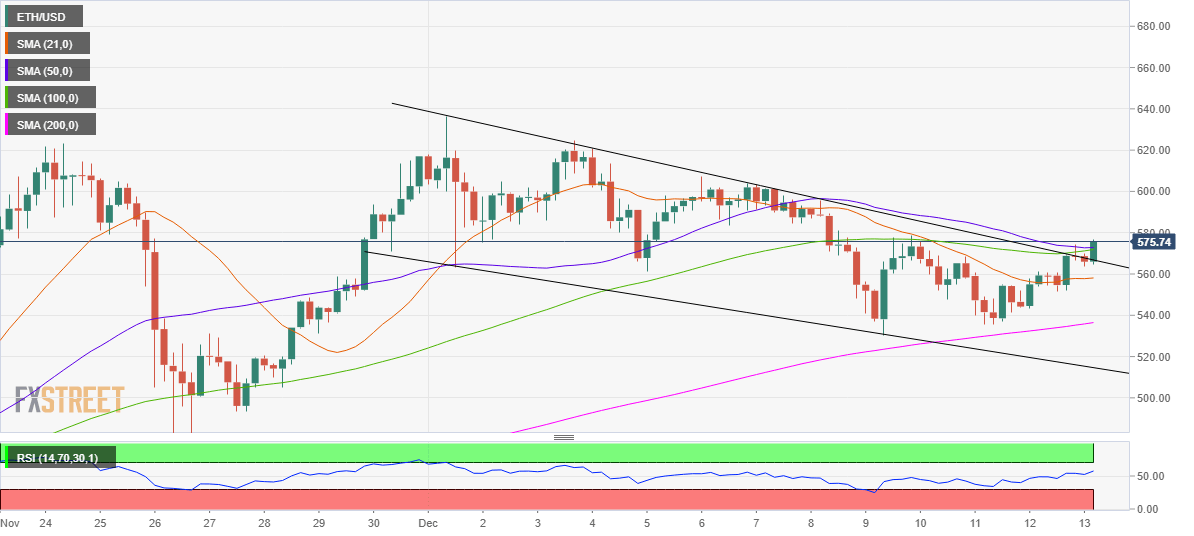
ETH/USD: 4-hour chart
The price has finally dived out of the two-week-old falling wedge formation, confirming a breakout on a close above the pattern resistance of $567.
The upside break also prompted the bulls to clear a critical resistance of $572, which is the confluence of the 50-simple moving average (SMA) and 100-SMA.
Acceptance above the latter opens doors for a test of the $600 mark. Buyers will then target the December 1 high of $636.53.
The Relative Strength Index (RSI) points north, now standing at 57.71, indicating the additional upside remains on the cards.
On the flip side, immediate support is seen at the horizontal 21-SMA at $558.
The next significant cushion awaits at $536, which is the upward-sloping 200-SMA.
ETH/USD: Additional levels to watch
Information on these pages contains forward-looking statements that involve risks and uncertainties. Markets and instruments profiled on this page are for informational purposes only and should not in any way come across as a recommendation to buy or sell in these assets. You should do your own thorough research before making any investment decisions. FXStreet does not in any way guarantee that this information is free from mistakes, errors, or material misstatements. It also does not guarantee that this information is of a timely nature. Investing in Open Markets involves a great deal of risk, including the loss of all or a portion of your investment, as well as emotional distress. All risks, losses and costs associated with investing, including total loss of principal, are your responsibility. The views and opinions expressed in this article are those of the authors and do not necessarily reflect the official policy or position of FXStreet nor its advertisers. The author will not be held responsible for information that is found at the end of links posted on this page.
If not otherwise explicitly mentioned in the body of the article, at the time of writing, the author has no position in any stock mentioned in this article and no business relationship with any company mentioned. The author has not received compensation for writing this article, other than from FXStreet.
FXStreet and the author do not provide personalized recommendations. The author makes no representations as to the accuracy, completeness, or suitability of this information. FXStreet and the author will not be liable for any errors, omissions or any losses, injuries or damages arising from this information and its display or use. Errors and omissions excepted.
The author and FXStreet are not registered investment advisors and nothing in this article is intended to be investment advice.
Recommended Content
Editors’ Picks
Crypto Sleeping Giants: Hedera Hashgraph price could shock the world

HBAR price shows a drop in volume amidst the current downtrend. Hedera Hashgraph has the potential to rally towards 2000%. Traders should keep the smart contract alternative token on their watchlists and consider a dollar cost average approach for investing.
Solana Price Prediction: How many hacked wallets does it take to spark a bull run?

Solana price continues to show mixed signals during the 2nd trading week of August. While several cryptocurrencies have displayed bullish vengeance, the centralized smart contract token has failed to reconquer losses experienced since May 12.
Is a 75% decline still possible for the Ethereum Classic price?

Ethereum Classic price rallied 100% between July 12 and July 24 before a short consolidation unfolded. After a few shallow days of sideways congestion, the Ethereum Classic price kicked off another 90% rally. Invalidation of the uptrend is dependent on $13 holding as support.
Ethereum Price Prediction: Get ready for a Wall Street discount

Ethereum price breaches target one at $1800, which was mentioned in July’s market bottom thesis. ETH price shows an influx of deposits on all exchanges. The midterm bullish forecasts are dependent on $1250 holding as support.
Bitcoin: If bulls lose control here, BTC could revisit $21,000

Bitcoin price shows an interesting setup that could reveal its next move. On closer inspection, its technicals support a bearish outlook for the leading crypto.