- Ethereum price recovery cut short at $235, allowing the sellers to sweep in forcing drop under $230.
- Ethereum remains relatively in the hands of bulls in spite of drop: The MACD recovery trend shows.
Ethereum price still lags the falling wedge pattern breakout discussed during the Asian session on Tuesday. The price is still stuck under $230 and dodders at $227 following a 2.12% loss. Volatility is shrinking by the hour, although the cryptocurrencies live rates show that the short term trend is in the hands of the bulls.
ETH/USD is also trading below the moving averages, whereby the 50 SMA on the 4-hour chart is contributing to the resistance at the weekly high at $235. The 100 SMA is holding the ground above the next hurdle at $240.
It is apparent that Ethereum will continue to explore the downside especially if the technical indicators keep sending bearish signals. Taking the RSI into account, we find that the path of least resistance is downwards. The same downtrend momentum is reflected by the momentum indicator in the same 4-hour timeframe.
On the other hand, the MACD’s recovery from -11.05 to -0.30617 suggests that the bulls are relatively in control. In addition, a bullish divergence stamps down on the bulls’ position above the bears. In other words, Ethereum remains bullish but lacks a catalyst to sustain growth above $230.
ETH/USD 4-hour chart
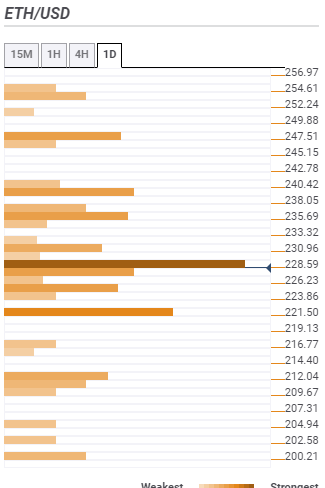
Ethereum confluence support and resistance"
Support one: $226.23 (SMA ten 4-hour and the Bollinger Band 1-hour lower curve).
Support two: $221 (Pivot Point one-day support one and the Fibo 61.8% one-month).
Support three: $212.04 (SMA 50 one-day and the BB one-day lower curve).
Resistance one: $228.59 (Fibonacci 38.2% one-day and the SMA ten 15-minutes).
Resistance two: $230 (BB 15-mins upper curve and the previous high 4-hour).
Resistance three: $235.69 (Previous high one-day and SMA 200 1-hour).
Information on these pages contains forward-looking statements that involve risks and uncertainties. Markets and instruments profiled on this page are for informational purposes only and should not in any way come across as a recommendation to buy or sell in these assets. You should do your own thorough research before making any investment decisions. FXStreet does not in any way guarantee that this information is free from mistakes, errors, or material misstatements. It also does not guarantee that this information is of a timely nature. Investing in Open Markets involves a great deal of risk, including the loss of all or a portion of your investment, as well as emotional distress. All risks, losses and costs associated with investing, including total loss of principal, are your responsibility. The views and opinions expressed in this article are those of the authors and do not necessarily reflect the official policy or position of FXStreet nor its advertisers. The author will not be held responsible for information that is found at the end of links posted on this page.
If not otherwise explicitly mentioned in the body of the article, at the time of writing, the author has no position in any stock mentioned in this article and no business relationship with any company mentioned. The author has not received compensation for writing this article, other than from FXStreet.
FXStreet and the author do not provide personalized recommendations. The author makes no representations as to the accuracy, completeness, or suitability of this information. FXStreet and the author will not be liable for any errors, omissions or any losses, injuries or damages arising from this information and its display or use. Errors and omissions excepted.
The author and FXStreet are not registered investment advisors and nothing in this article is intended to be investment advice.
Recommended Content
Editors’ Picks
Ripple's move above this key level could trigger nearly 50% rally for XRP
Ripple has overcome a critical resistance level and flipped into a support floor on the weekly time frame. This development happened while XRP tightly consolidated for roughly 250 days. Investors can expect XRP to kickstart a massive rally.
Optimism price outlook with nearly $90 million worth of OP tokens flooding markets on Friday
Optimism volatility has shrunk in the ours leading to the network’s cliff unlock. It joins the likes of dYdX and Sui, which have similar events on their calendars. As token unlocks are often considered bearish catalysts, investors should brace for a reaction after the event.
Top 3 Price Prediction Bitcoin, Ethereum, Ripple: Retail watches from the sidelines with a bias for shorts
Bitcoin could clear $73,777 peak as BTC bulls resurface. Ethereum might fall 10% before next leg up as ETH RSI teases with sell signal. XRP could lose $0.6000 threshold as Ripple bulls fail to show up.
Jito price could hit $6 as JTO coils up inside this bullish pattern
Jito price action shows a potential cup and handle formation. Based on theoretical measurement rules, a successful breakout could yield a 56% rally to $6.0. A breakdown of the $3.86 support level would create a lower low for JTO and invalidate the bullish thesis.
Bitcoin: BTC may have recovered, but is it out of the woods?
Bitcoin’s (BTC) upward momentum has shown a significant decline for the past two weeks or so. This development led to a bearish signal on the weekly and an uncertain outlook on the monthly.