Ethereum Price Prediction: ETH/USD free-falls after rejection at $245 – Confluence Detector
- Ethereum price drops under $240 following rejection at $245.
- ETH/USD downside is protected by the 200 SMA at $245, $225 and $218.

Ethereum price broke out of the consolidation witnessed in the first week of July between the key support at $225 and the resistance at $230. Boosting the price action above $235 and $240 was the momentum from overcoming the resistance at the 200 SMA in the 4-hour chart. Ether extended the bullish leg towards $245 but due to increased selling pressure, a reversal followed.
At the time of writing, ETH/USD is spiraling under $240. It is trading at $238 after a 1.13% loss on the day. The trend has a bearish bias which could eventually pull the price under $235. The negative technical picture is highlighted by the RSI’s retreat from the overbought region.
The MACD also hit a snag under 4.00 after recovery from levels marginally below the midline as encountered on July 5. A bullish divergence is still visible which shows that buying power has not been ousted entirely. In case the losses continue, the 2-hour chart places support at the 200 SMA ($235), the main support at $225 and the primary support at $215.
ETH/USD 2-hour chart
 (53)-637296870474968151.png)
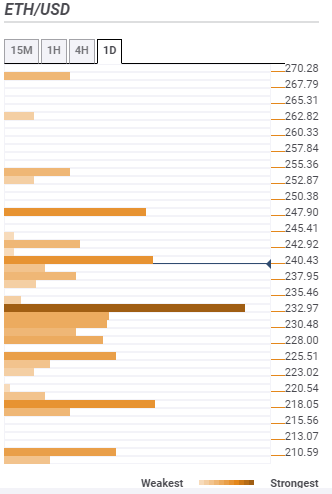
Ethereum key confluence levels
Resistance one: $240 – This region is home to the previous high 15-minutes, the SMA five 15-minutes, the Bollinger Band 4-hour upper, the pivot point one-week resistance two and the SMA five 1-hour.
Resistance two: $247 – Highlighted the pivot point one-day resistance one, pivot point one-month resistance one and the pivot point one-week resistance three.
Support One: $232 – Home to the Bollinger Band 1-hour lower, the SMA ten 4-hour, the pivot point one-day support one, the previous week high and the Fibo 61.8% one-day.
Support two: $225 – Highlighted by the Fibo 23.6% one month.
Support three $218 - Home to the Bollinger Band 1-day lower curve and Bollinger Band 4-hour upper curve.
Author

John Isige
FXStreet
John Isige is a seasoned cryptocurrency journalist and markets analyst committed to delivering high-quality, actionable insights tailored to traders, investors, and crypto enthusiasts. He enjoys deep dives into emerging Web3 tren


