Ethereum Price Prediction: ETH/USD $280 bullish scenario after consolidation – Confluence Detector
- Ethereum consolidation intact despite Bitcoin (BTC) brief surge above $9,800.
- ETH/USD technical picture would remain drab as long as the MACD and the RSI continue with the leveling motions.

Ethereum failed to react to Bitcoin’s brief recovery to highs above $9,800 on Wednesday during the Asian session. Ether has only managed to adjust from $244.03 (opening value) to $244.88 (intraday high) on the day. The prevailing trend is still bearish with the price hitting an intraday low at $243.57. The low trading volume hints that rapid price actions will remain limited in the near term.
ETH/USD has been in consolidation since the rejection from highs close to $255 last week. The bulls were able to hold above $240. The choppy market continues to keep most of the buyers in the sidelines. If push comes to shove a further retreat towards $235 and $230 could help revive the uptrend by encouraging more buyers to end the market at a lower price in anticipation of gains above $250 and $280.
The technical picture remains drab owing to the sideways moving indicators. The RSI and the MACD have not shown any sign of change in the last few days. If the leveling motion continues, ETH/USD is expected to remain in consolidation a while longer. On the brighter side, the gap made by the 50 SMA above the 200 SMA shows that bulls have the upper hand, although they lack the momentum to push for gains above $250 and $280 respectively.
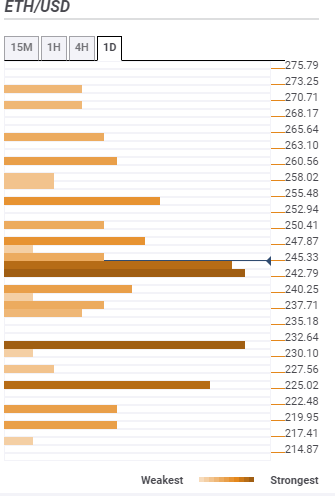
ETH/USD daily chart
 (31)-637273535382940018.png)
Ethereum confluence support and resistance
Resistance one: $245.33 – Highlights the SMA ten 15-minutes, the Bollinger Band 15 minutes middle curve, the previous high 1-hour and the SMA five 15-minutes.
Resistance two: $250 – Home to the previous high one-day and the pivot point one-day resistance one.
Support one: $242.79 – Hosts the Fibo 38.2% one-day, SMA 200 1-hour, SMA 100 1-hour, the Bollinger Band 1-hour and the previous low 4-hour.
Support two: $232 – Fibo 23.6% one-month, the pivot point one-day support two and the Fibo 23.6% one-week.
Author

John Isige
FXStreet
John Isige is a seasoned cryptocurrency journalist and markets analyst committed to delivering high-quality, actionable insights tailored to traders, investors, and crypto enthusiasts. He enjoys deep dives into emerging Web3 tren



