Ethereum Price Prediction: ETH is eying up $400 as the uptrend continues
- Ethereum is currently trading at $365 after a healthy rebound from its low at $310.
- The current bullish momentum might have enough strength to push the digital asset towards $400.

Ethereum bulls have regained some ground in the short-term, getting back $5 billion in market capitalization. The digital asset traded as low as $310 on September 5, and it’s now trading at $364.
Ethereum is poised for further gains according to indicators
Several indicators support the theory that Ethereum still has more room to the upside, at least in the short-term. If we look at the 12-hour chart below, we can observe a ‘9’ buy signal from the TD sequential indicator.
ETH/USD 12-hour chart
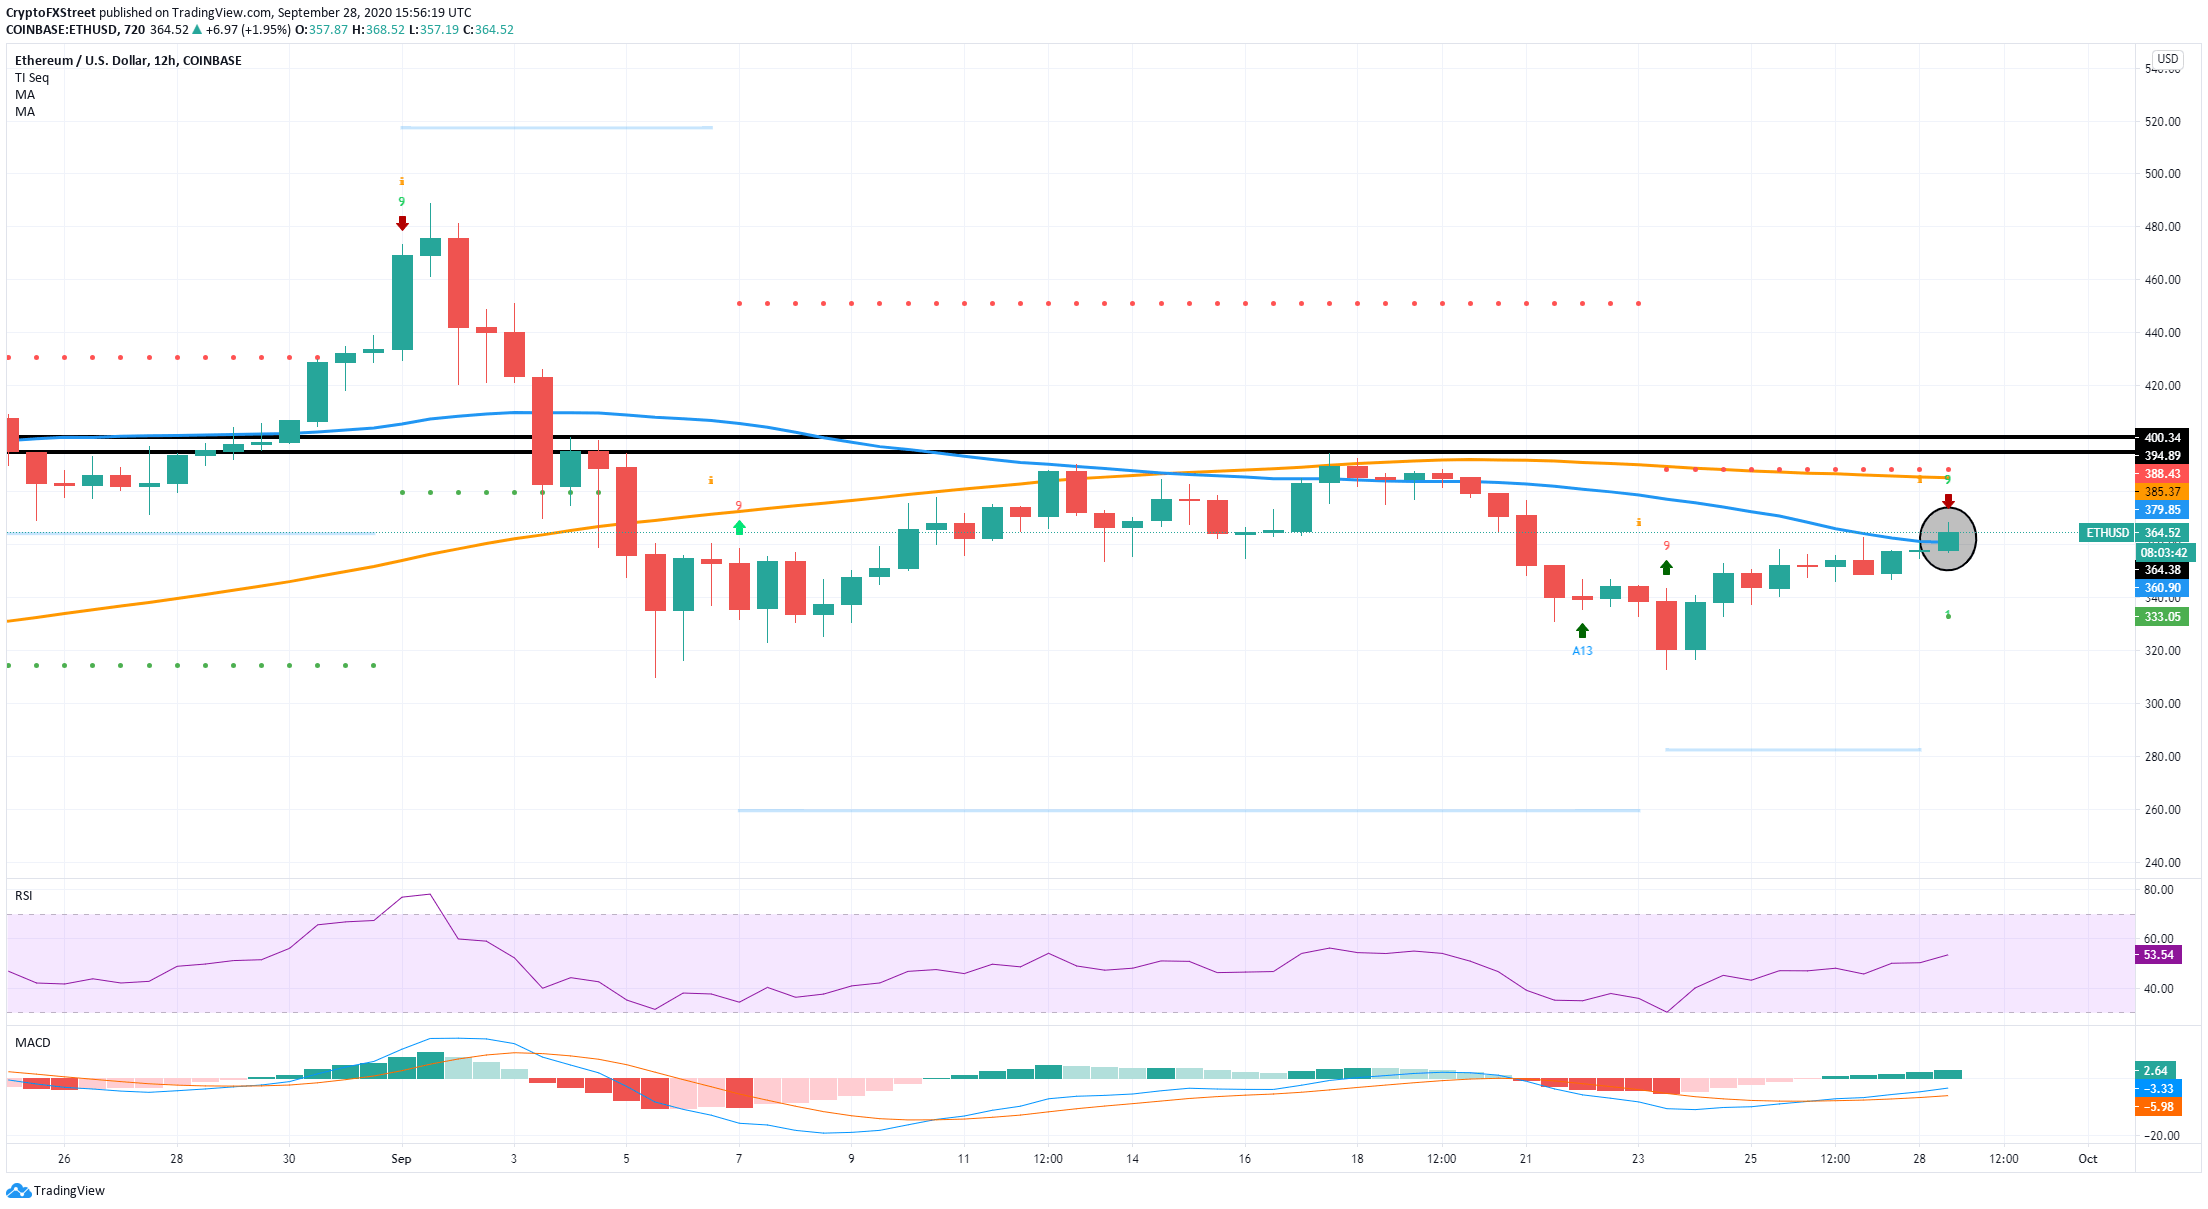
ETH's price has just climbed above the 50-MA, and it’s trying to turn it into a support level. The MACD has turned bullish on September 26 and remains strong.
Ethereum IOMAP Chart
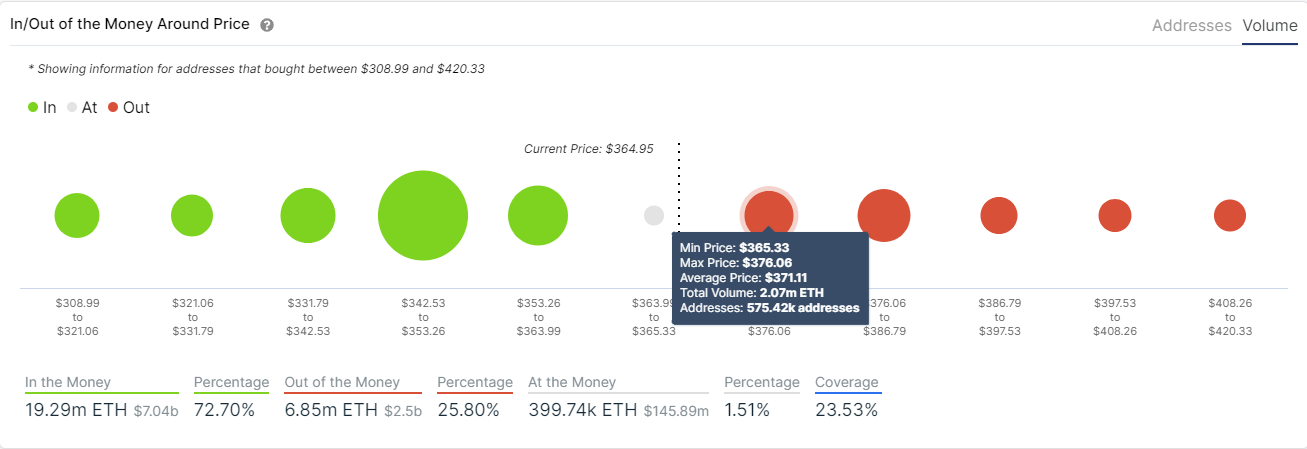
When looking at possible resistance levels on the way up, the In/Out of the Money Around Price chart by IntoTheBlock provides us with some valuable information. Right off the bat, we can observe that very few addresses bought at $365 and above in comparison to $353 and below. The area between $365 and $376 only has 2 million ETH in volume, a minuscule number compared to the 10 million ETH in volume at the $342-353 area.
This chart shows that Ethereum has way more support than resistance, which would validate the buy signal. The 100-MA at $385 will also pose some resistance for the bulls in the short-term.
Ethereum is facing other challenges ahead
While the 12-hour chart is heavily in favor of the bulls, other time frames like the 4-hour chart show signs of a short-term pullback.
ETH/USD 4-hour chart
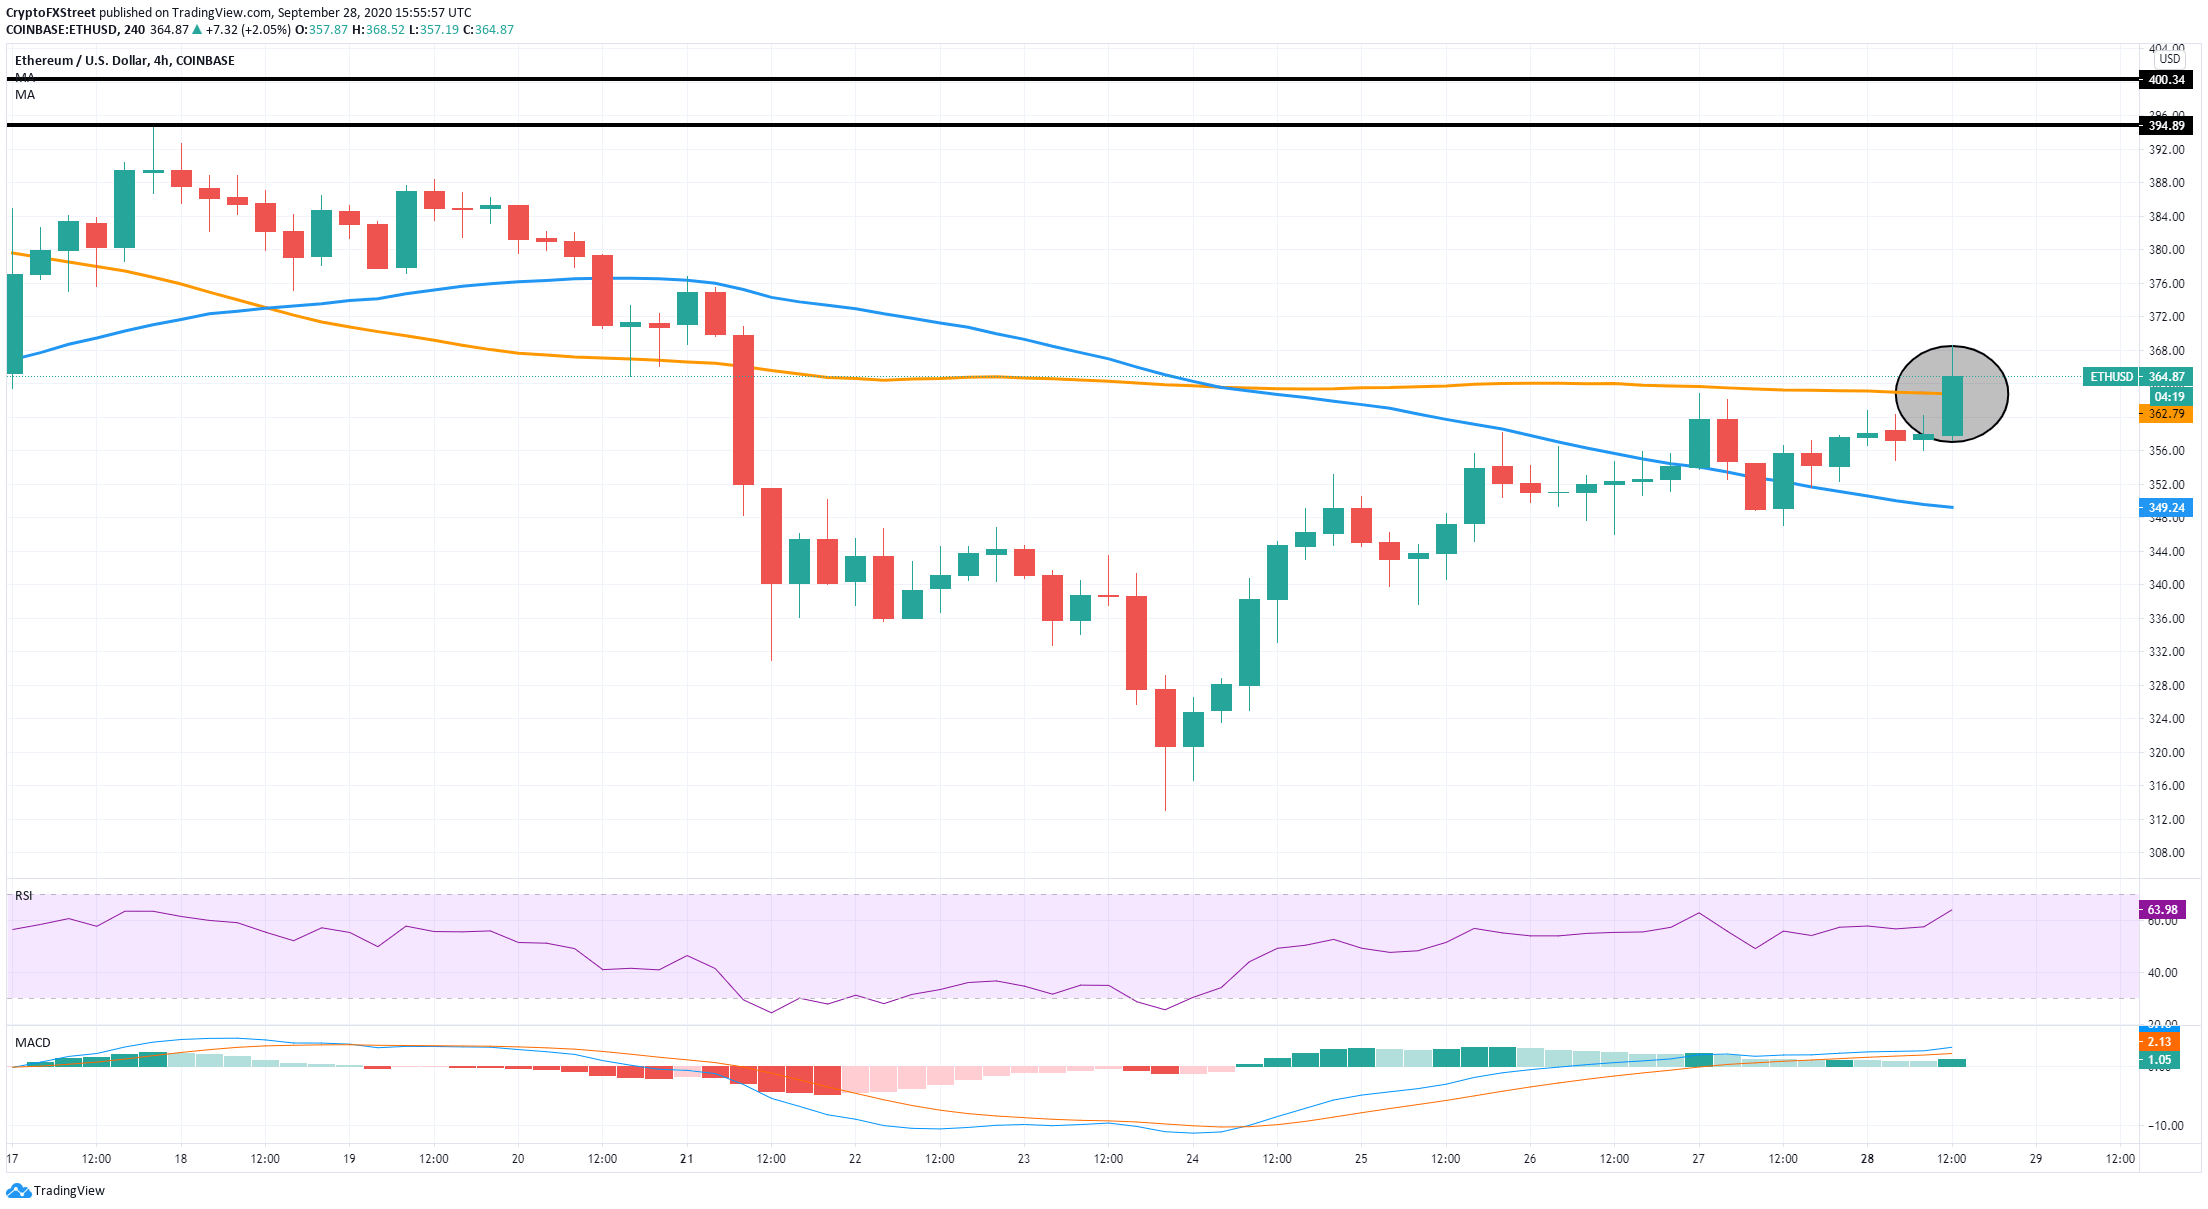
On the 4-hour chart, the price of the smart-contracts giant is currently fighting to stay above the 100-MA at $362. A rejection from this level would be notable and likely to take ETH down to the 50-MA at $349, which coincides with the most significant support area on the IOMAP chart.
ETH IOMAP Chart
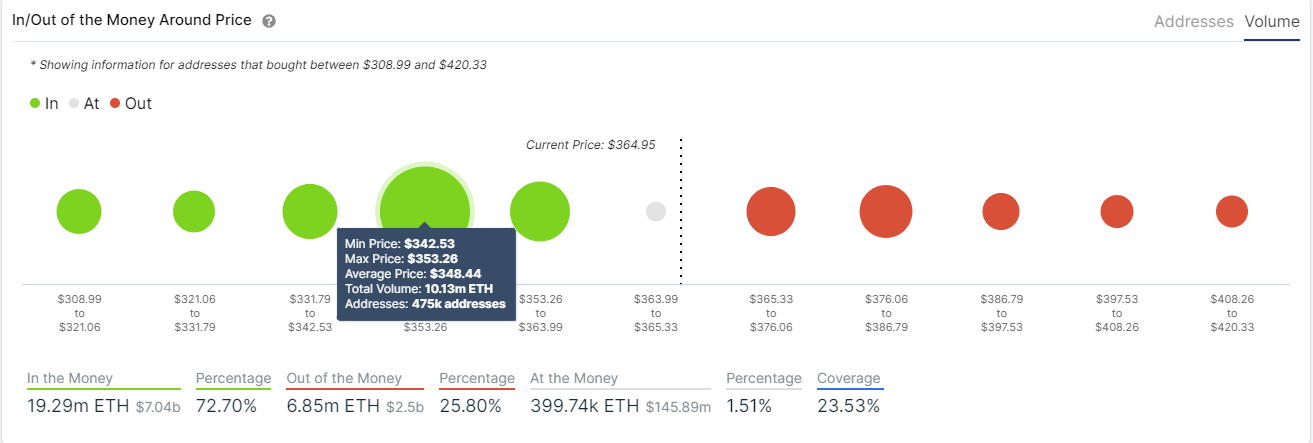
Bulls need to pay close attention to the $348 support level as it represents a vital pillar for Ethereum in the short-term.
On the other hand, if the buy signal is validated, we could see Ethereum test the 100-MA at $385 and the $400 psychological level before the next correction.
Author

Lorenzo Stroe
Independent Analyst
Lorenzo is an experienced Technical Analyst and Content Writer who has been working in the cryptocurrency industry since 2012. He also has a passion for trading.


