Ethereum price needs to overcome this obstacle to resume ETH bull rally in February 2023
- Ethereum price enjoyed a 30% run in January 2023; it remains to be seen whether the altcoin will sustain its gains in February.
- The US Federal Reserve's reduced 25 bps rate hike and Powell’s dovishness seems to have been priced in, yielding 5.5% for ETH.
- Experts believe bullish sentiment among Ethereum holders has weakened significantly in past weeks, which could push ETH price lower.

Ethereum price rallied 5.5% overnight; in what could be a spillover of the altcoin's 30% gains in January. ETH continued yielding gains for holders in response to the outcome of the Fed’s February FOMC on Wednesday.
Whilst it had been widely expected that Fed board members would raise interest rates by a lower 25 bps hike, investors were surprised by Fed Chairman Jerome Powell’s declaration that "For the first time, we can declare that a deflationary process has begun," which suggested they were close to ending the tightening process.
Technical indicators signal a weakening bullish sentiment among Ethereum holders, are a further factor that could drive ETH prices lower in February.
Ethereum holders' bullish sentiment is waning; can ETH sustain its rally?
Ethereum, the second-largest cryptocurrency by market capitalization, had an impressive 30% price rally in January, alongside Bitcoin. Within 31 days, ETH wiped out losses from the FTX exchange crash of November. The price jump in the altcoin erased the losses from the unexpected implosion of the FTX exchange and the prolonged bear market of 2022.
Interestingly, profit-taking in Ethereum intensified on January 30, and ETH holders shed some (if not all) of their holdings in February. Experts argue that ETH's Aroon Indicator reveals a weakening of the bullish sentiment.
The Aroon indicator is a technical indicator used to identify trend changes and the strength of a trend. The idea is that strong uptrends will regularly see new highs, and strong downtrends will regularly see new lows. The indicator signals when this is happening.
The "Aroon up" line measures the strength of the uptrend, and the "Aroon down" line measures the strength of the downtrend. On the daily chart, the Aroon Indicator reveals that the bullish sentiment has weakened significantly in the past few weeks. The Aroon Up line was spotted at 21.43%.
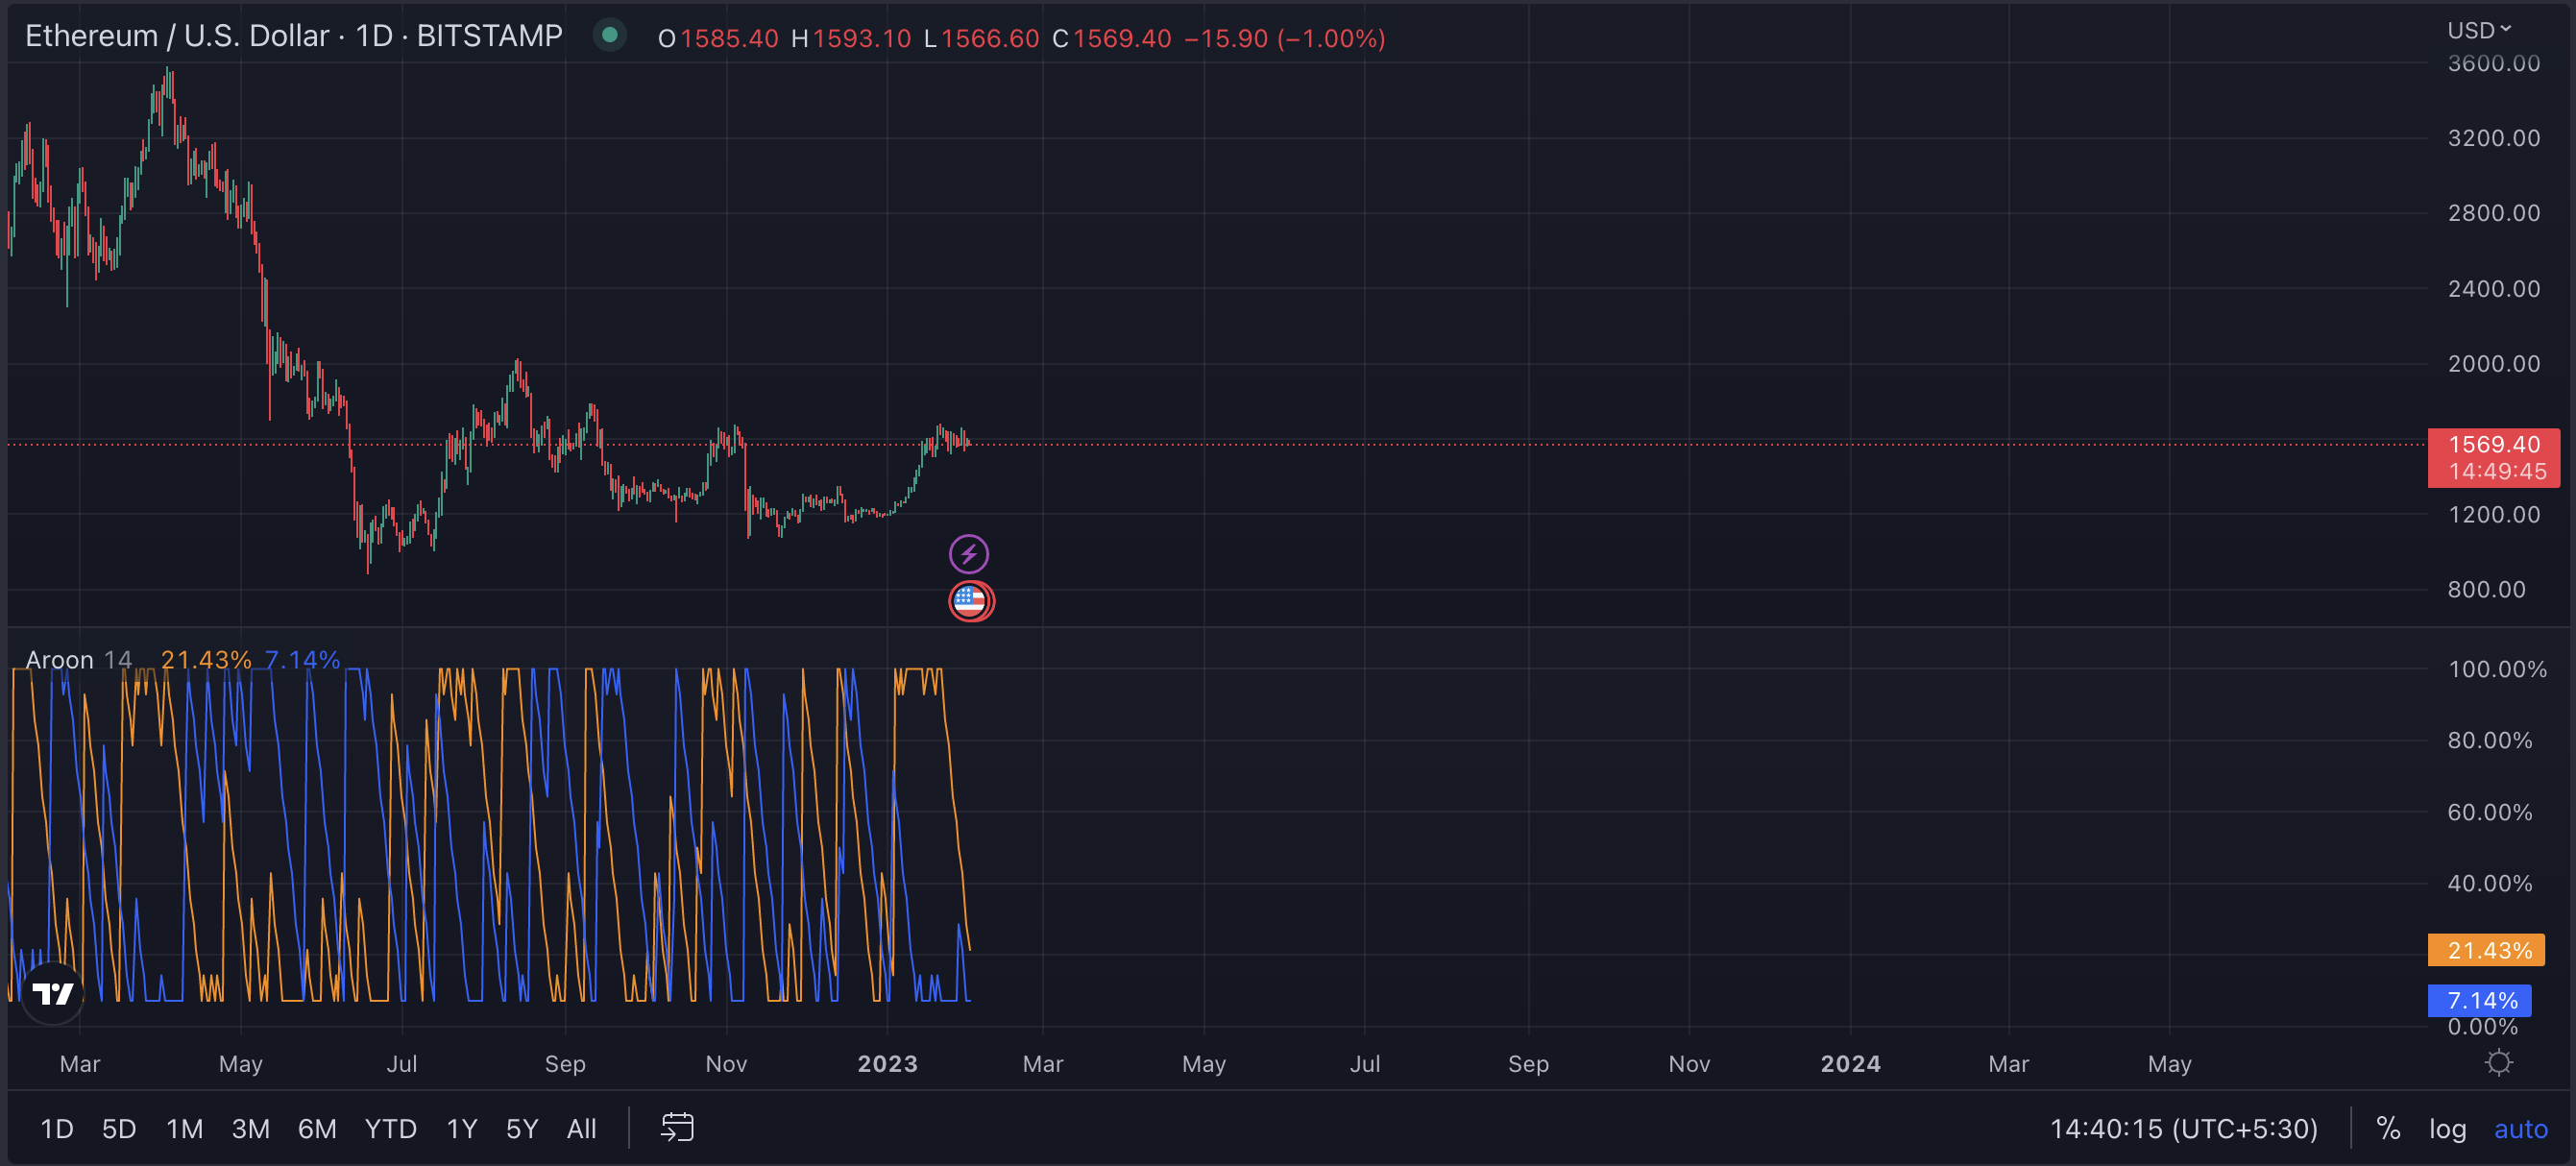
ETH/USD price chart
Usually, when the Aroon Up line approaches zero, it suggests a weak uptrend and a distant recent high. This supports the narrative of a possible trend reversal in Ethereum.
Ethereum is currently riding the bullish sentiment from Powell’s dovish view and its strong rally in January. However, a decline below the support at the 23.6% Fibonacci retracement level at $1587.20 could invalidate the bullish thesis.
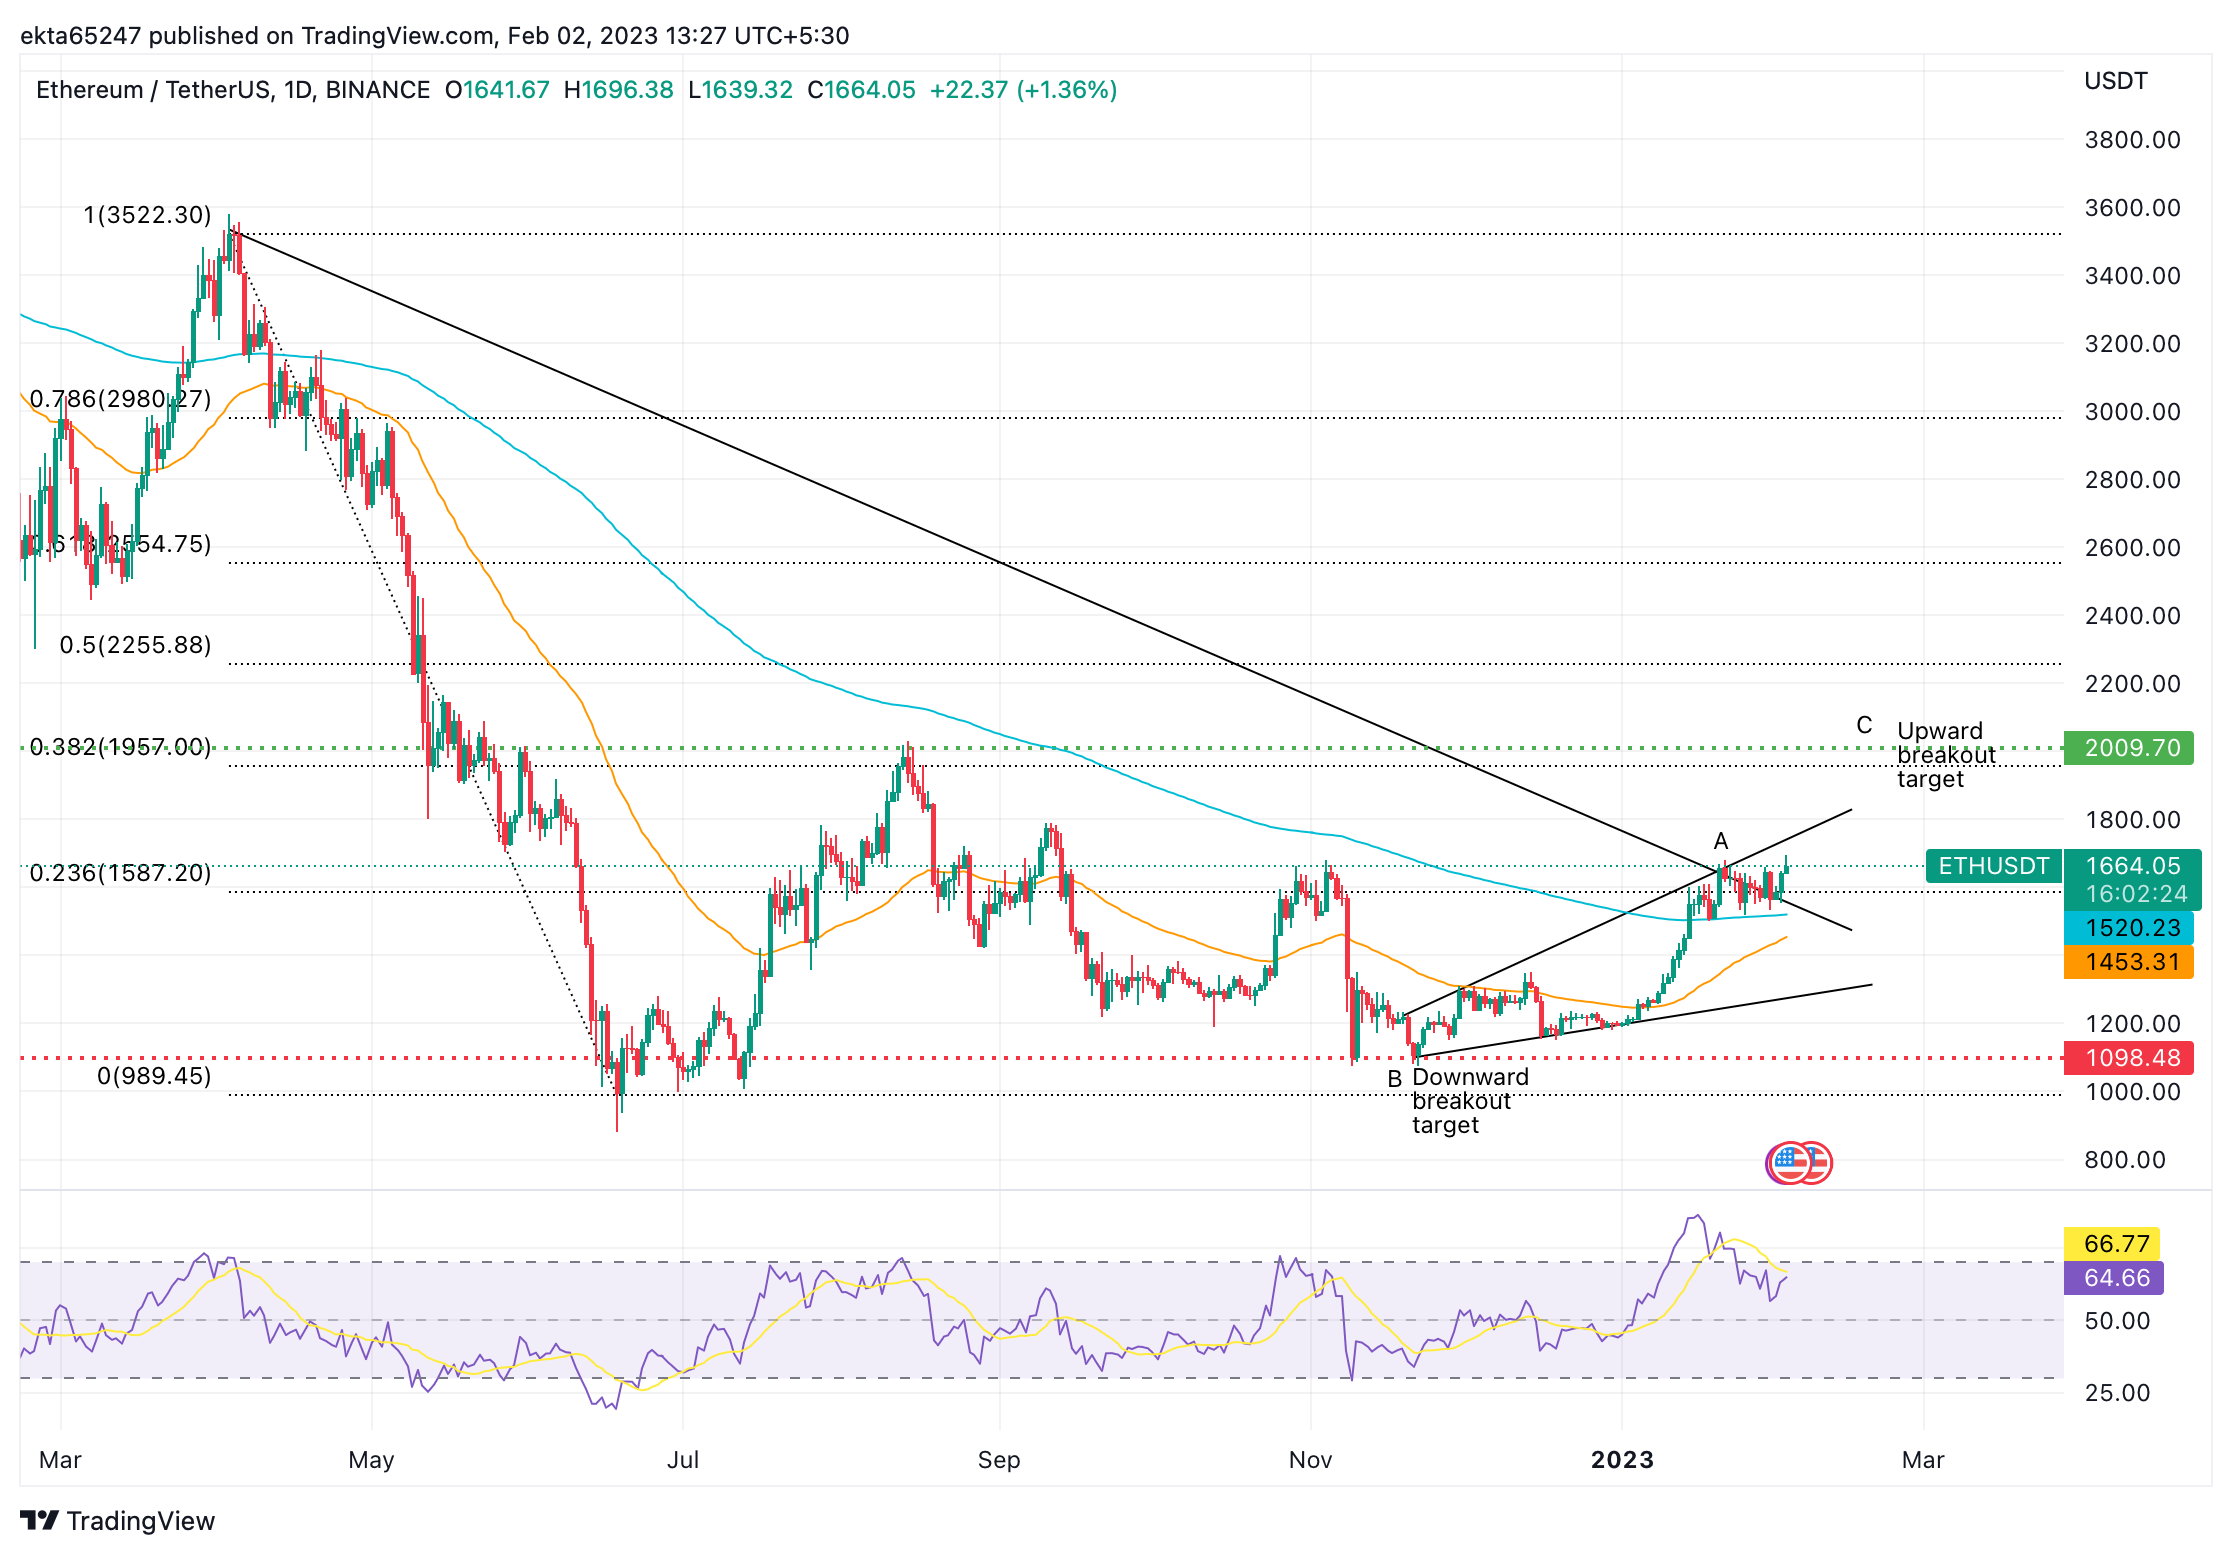
ETH/USDT 1D price chart
As seen in the chart above, Ethereum broke out of its multi-month downtrend from May in January 2023. The altcoin’s price climbed consistently, in an ascending broadening wedge, with a downward breakout target at B ($1,098.48) and an upward breakout target at C ($2,009.70), using veteran trader and analyst Thomas Bullkowski’s measure rule.
Ethereum’s 200-day and 50-day Exponential Moving Averages (EMAs) are acting as key supports for the altcoin at $1,520.23 and $1,453.31. The 38.2% Fibonacci retracement level at $1,957 is a key resistance before Ethereum hits an upward breakout target of $2,009.70.
The Relative Strength Index (RSI), a momentum indicator currently reads 64.66, the RSI is therefore below the overbought zone at 70. This implies that there is room for a rally in Ethereum price, however the bearish divergence in RSI signals a weakening uptrend, similar to the conclusion from the Aroon indicator.
Traders need to be cautiously optimistic when adding to their ETH positions since there is a likelihood of a trend reversal in February 2023, while the short-term view remains bullish.
Author

Ekta Mourya
FXStreet
Ekta Mourya has extensive experience in fundamental and on-chain analysis, particularly focused on impact of macroeconomics and central bank policies on cryptocurrencies.


