Ethereum price likely to outperform BTC says JP Morgan report, but short-outlook remains flat despite ETF hype
- Invesco Digital’s Ethereum spot ETF’s approval is delayed.
- Ethereum price is likely to hover between the $2,030 and $2,539 levels for the next few weeks.
- On-chain metrics note a decline in user activity, which could add headwinds to the uptrend.

Ethereum (ETH) price is likely to overshadow Bitcoin price performance in 2024 said JP Morgan analysts in a recent note. Ether traded in the $2,400 region after nearly three weeks of consolidation but this uptrend seems to have lost momentum as Bitcoin price takes a hit this week. Despite the Bitcoin ETF approval hype, ETH continues to remain largely neutral as other altcoins outperform Ether. In the near future, ETH is likely to slip into sideways movement due to a few reasons: a slump in on-chain activity, a delay in ETF approval from the US Securities and Exchange Commission (SEC), a fast-approaching holiday season, and a lack of momentum to push Bitcoin price higher.
Also read: Ethereum revenue could double to $5 billion and fee may fall to $0.01 in 2024: Bitwise prediction
SEC delays Ethereum ETF
As noted by Bloomberg Analyst James Seyffart, the Commission has decided to delay the Invesco Galaxy Ethereum ETF. The analyst adds that “this was early but completely expected.”
Update: SEC delayed @InvescoUS / @galaxyhq Ethereum ETF application -- This was early but completely expected. (Wasn't due until Dec 23rd I think) pic.twitter.com/jFCjnND3Rf
— James Seyffart (@JSeyff) December 13, 2023
Invesco and Galaxy Digital filed for an Ether spot ETF in September, but like Bitcoin’s ETFs, Ether’s is likely to be delayed before the SEC gives a decision. Additionally, the Commission remains unclear on its stance as to whether Ether is a security or a commodity, which makes the approval of an Ethereum ETF highly speculative.
Read more: Hashdex tips spot Bitcoin ETFs to trade by Q2, followed by Ethereum
Ethereum price remains neutral-to-bullish
Ethereum price action between June 2022 and November 2023, created an ascending triangle setup. This technical formation is a bullish pattern in which the asset price creates higher lows and equal highs. In Ether’s case, three distinctive higher lows and three equal highs formed.
Connecting the equal highs shows a horizontal resistance level at $2,030. This level was broken on November 20, indicating the upside potential of the pattern was activated. The ascending triangle setup forecasts a 43% upswing to the $2,943 level, obtained by measuring the distance of the widest part of the triangle and extrapolating it higher.
Ethereum price’s breakout was succeeded by a 16% rally to a local top at $2,403. Since then, ETH has dropped 6.3% and currently trades at $2,252. Going forward, the smart contract token is likely going to move sideways between the ascending triangle’s base at $2,030 and the weekly resistance level at $2,539.
A decisive flip of the $2,539 will open the path for Ethereum price to continue rising to its theoretical target of $2,943 or the $3,000 psychological level.
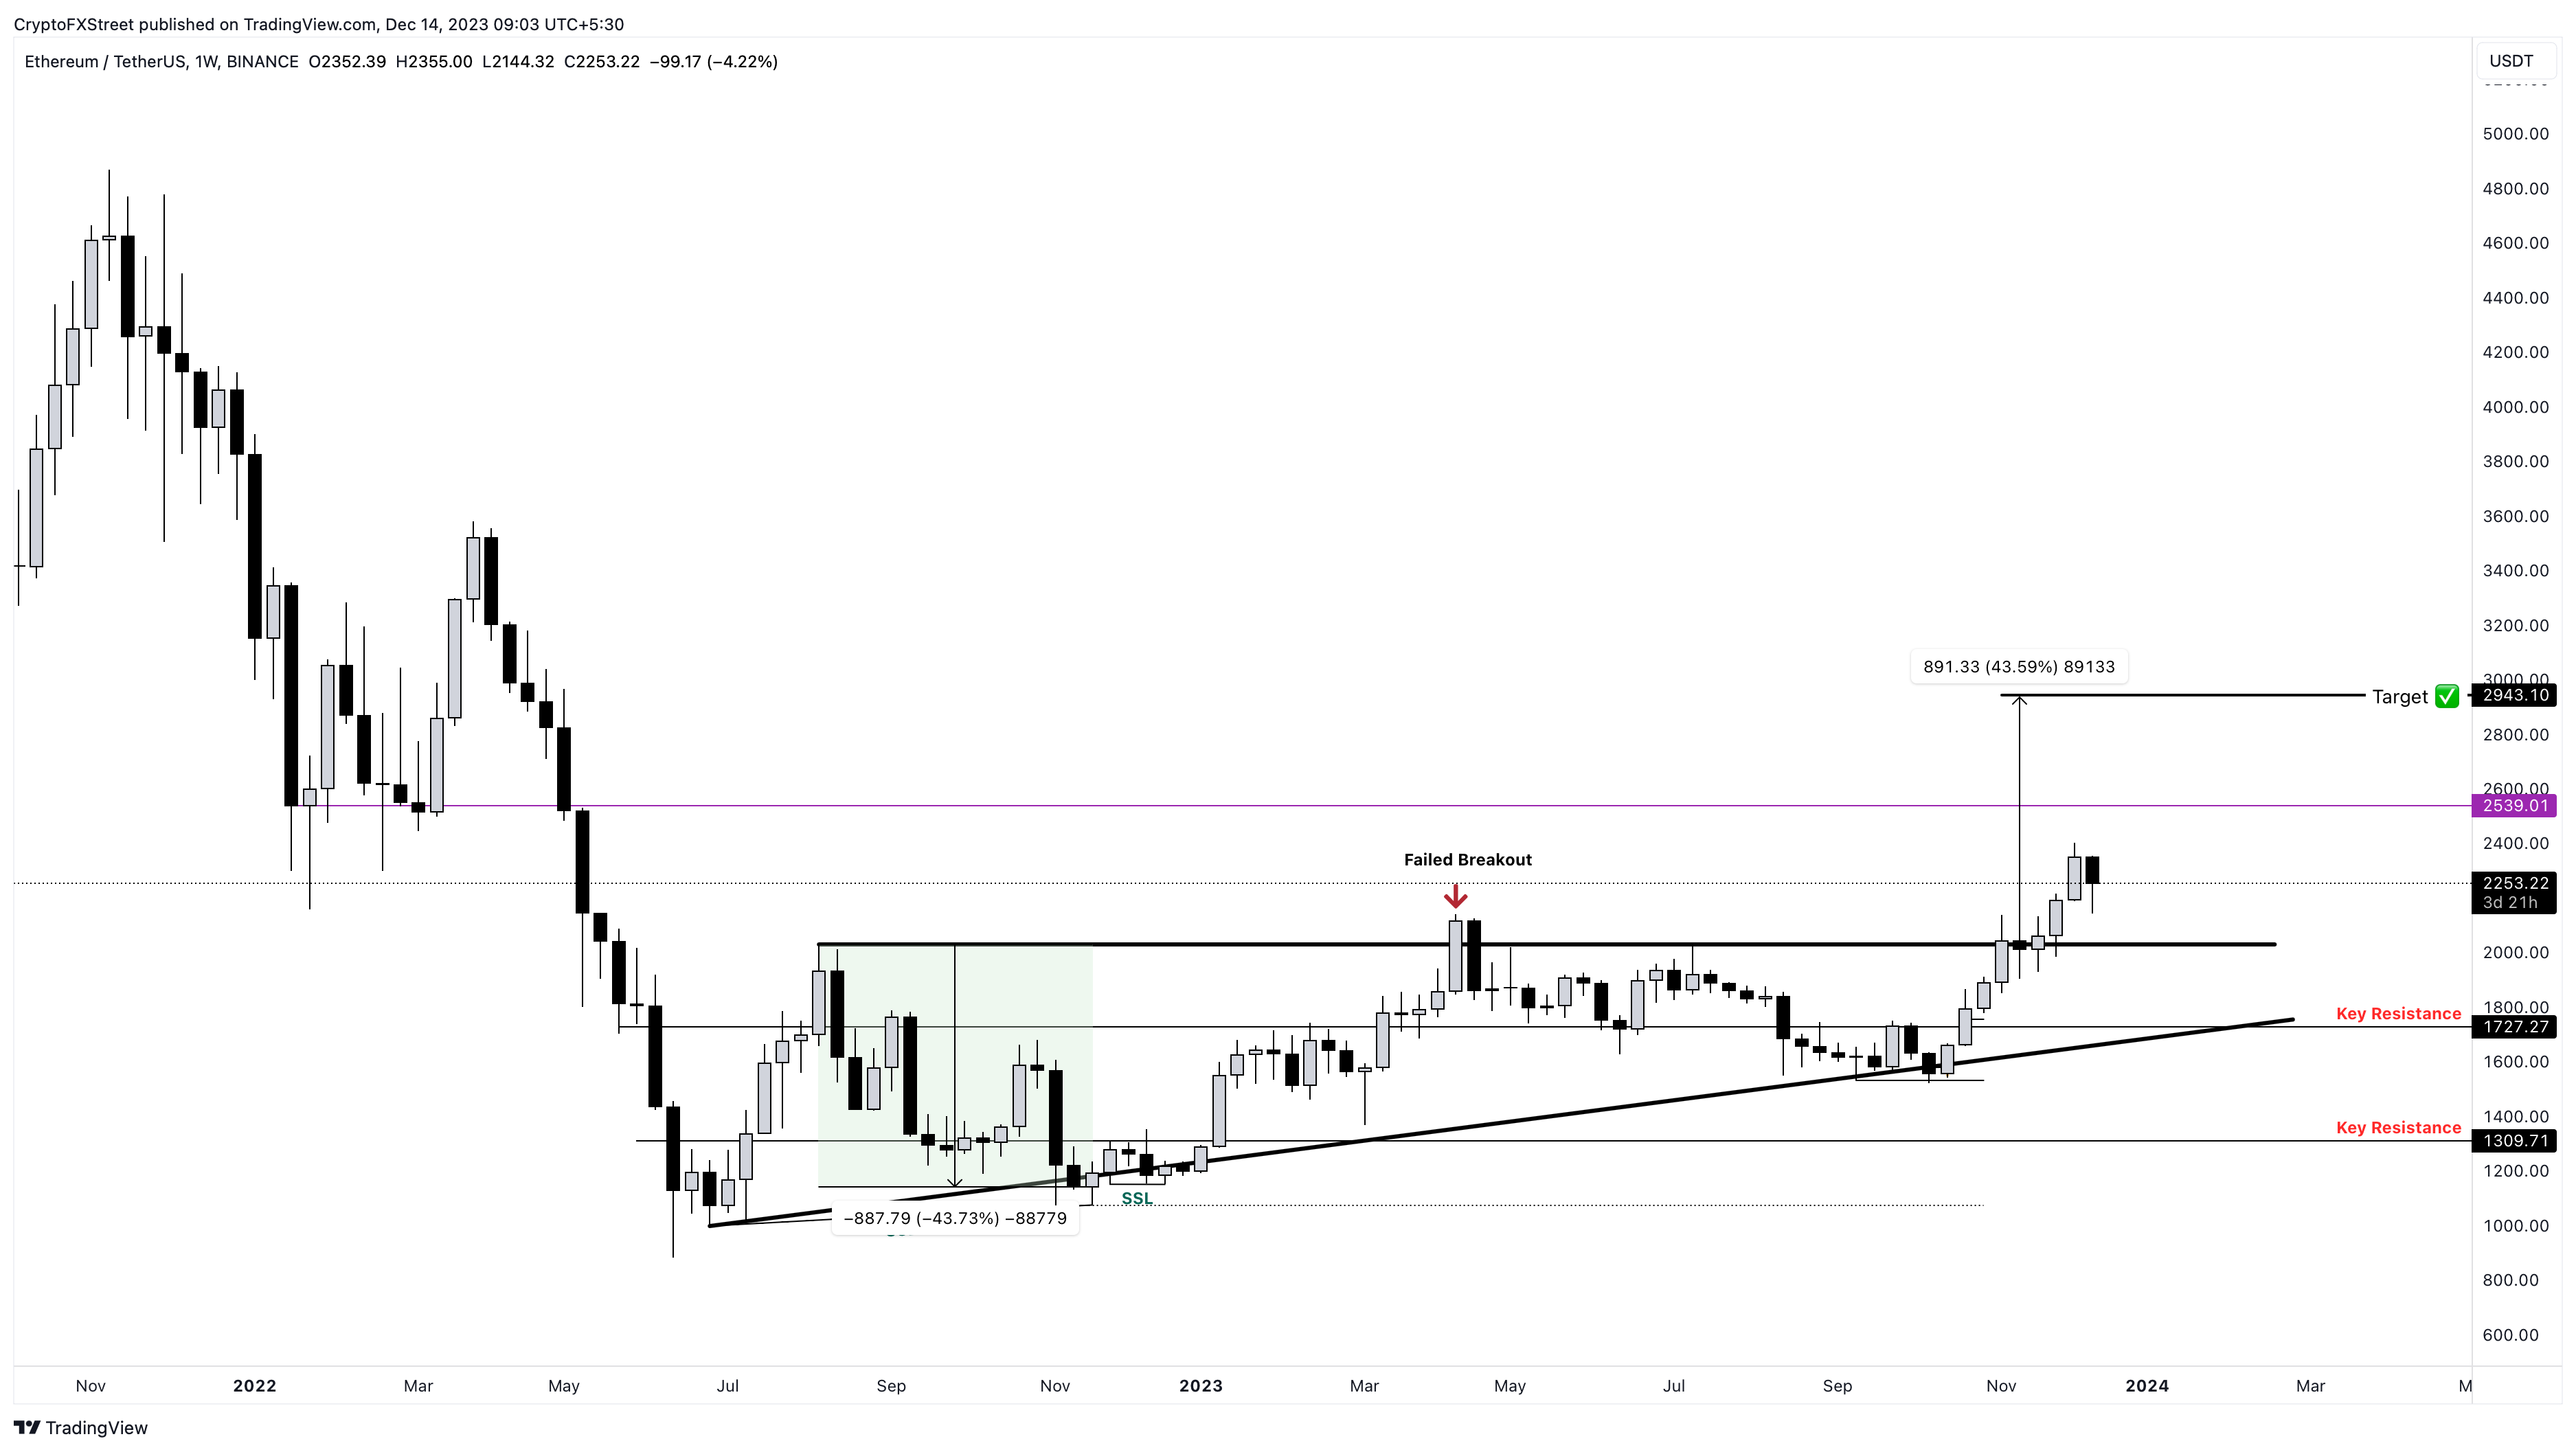
ETH/USDT 1-week chart
Ethereum’s Social Dominance metric has been trending lower since September 30, showing a decline in interest for ETH among investors.
 [12.02.13, 14 Dec, 2023]-638381408449905223.png)
ETH Social Dominance
According to data from Santiment, On-chain Volumes saw a spike on November 10 but has been steadily slumping since then. The same can be said about Whale Transaction Count, which has also seen a decline.
 [11.57.12, 14 Dec, 2023]-638381408628188781.png)
ETH On-chain Volume, WTC
While this is bearish in the short term, the Active Addresses have been in an uptrend since mid-September. Network Growth has also remained consistent, which shows that the investors are being patient about the mid-to-long term outlook.
 [11.57.15, 14 Dec, 2023]-638381408995188184.png)
ETH Active Addresses, Network Growth
A decisive breakout above $2,539 could signal a bullish outlook for ETH. In such a case, the Ethereum price could eye a retest of the $3,000 psychological level.
On the other hand, a breakdown of the $2,030 support level could trigger a 15% crash in Ethereum price to $1,727.
Author

Akash Girimath
FXStreet
Akash Girimath is a Mechanical Engineer interested in the chaos of the financial markets. Trying to make sense of this convoluted yet fascinating space, he switched his engineering job to become a crypto reporter and analyst.


