Ethereum price is on a steep decline targeting $1250, here’s what traders should be aware of
- Ethereum price surges through a key Fib level.
- A death cross of two significant moving averages has occurred.
- Invalidation of the bearish thesis is a closing candle above $1,560.

Ethereum price is losing support and picking up bearish momentum
Ethereum price warrants concern
Ethereum price is developing more bearish signals as the weekend progresses. Since Friday, September 10, the bears have forged a 22% decline. The decline comes at an interesting time as the market sentiment has been quite bullish with speculation that the Merge would bring fruitful returns.
Ethereum price currently auctions at $1,384. The 8-day exponential and 21-day simple moving averages have produced a classical death cross mentioned in the previous thesis as a significant “get out of the way” signal.
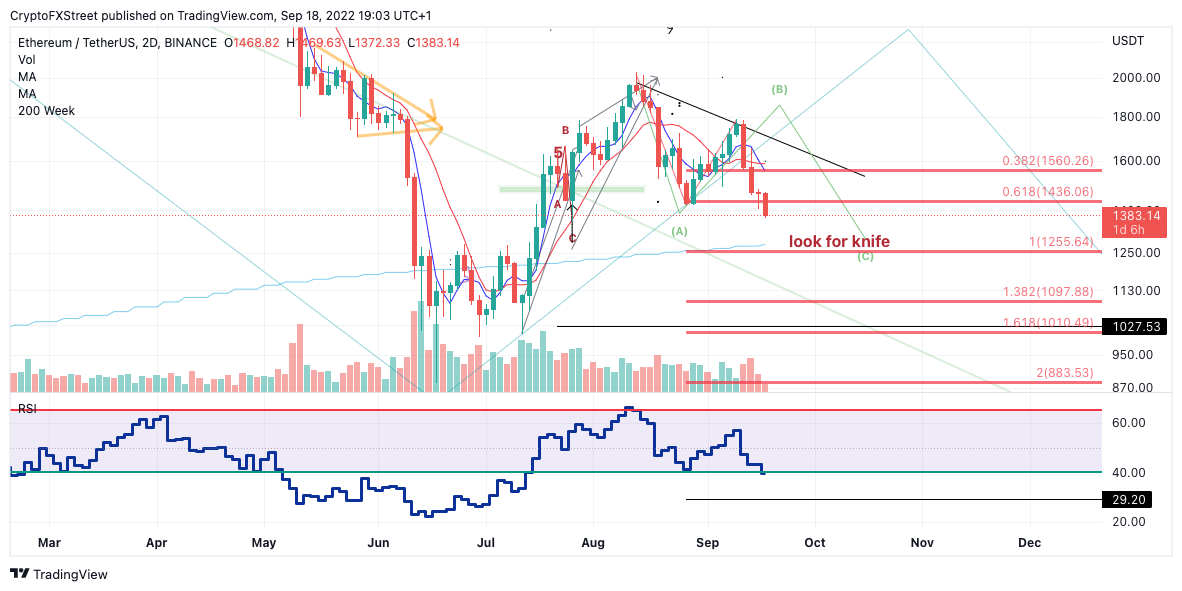
ETH USDT 2-Day Chart
A Fibonacci projection tool from the strongest $2,030 high projected into the recent pullback near $1,800 suggests that the bears have surpassed the 61.8% FIb level. Based on Elliott Wave and Fibonacci theory, Ethereum bulls may remain sidelined until the 100% FIb level is tagged at $1,250. The 1,250 level has additional confluence as the 200-week moving hovers in the same territory.
Invalidation of the bearish thesis can occur if the bulls can hurdle both moving averages at $1,560, In doing so,a countertrend rally could occur towards $2,000. Said price action would result in a 46% increase from the current Ethereum price.
In the following video, our analysts deep dive into the price action of Ethereum, analyzing key levels of interest in the market. -FXStreet Team
Author

Tony M.
FXStreet Contributor
Tony Montpeirous began investing in cryptocurrencies in 2017. His trading style incorporates Elliot Wave, Auction Market Theory, Fibonacci and price action as the cornerstone of his technical analysis.


