Ethereum price is no longer playing second fiddle to Bitcoin
- Ethereum price rallying on news that Visa will use its network to settle transactions.
- March 31 breakout preceded by a symmetrical triangle.
- Weighted social sentiment flips to slightly bullish from extremely bearish.

Etheruem price printed an all-time on April 2 on above-average for the first time since February 3. ETH has been strongly rising since last week on the news that Visa would be using the Ethereum network to settle cryptocurrency transactions. Adding to the bullish anthem were Mark Cuban’s comments about owning the token and that it’s closest “to a true currency.”
Ethereum price reclaims the psychologically important $2,000
As the second-largest cryptocurrency, ETH does capture traders’ attention. Still, the tendency to track the price movements of Bitcoin has always had it playing second fiddle to the pioneer cryptocurrency.
The ETH breakout has captured social media attention, lifting the Weight Social Sentiment from overwhelmingly bearish to marginally bullish over the last few days. In contrast, it is occurring as Bitcoin’s social media mood further declines, indicating a lack of confidence in the top coin’s short-term price potential.
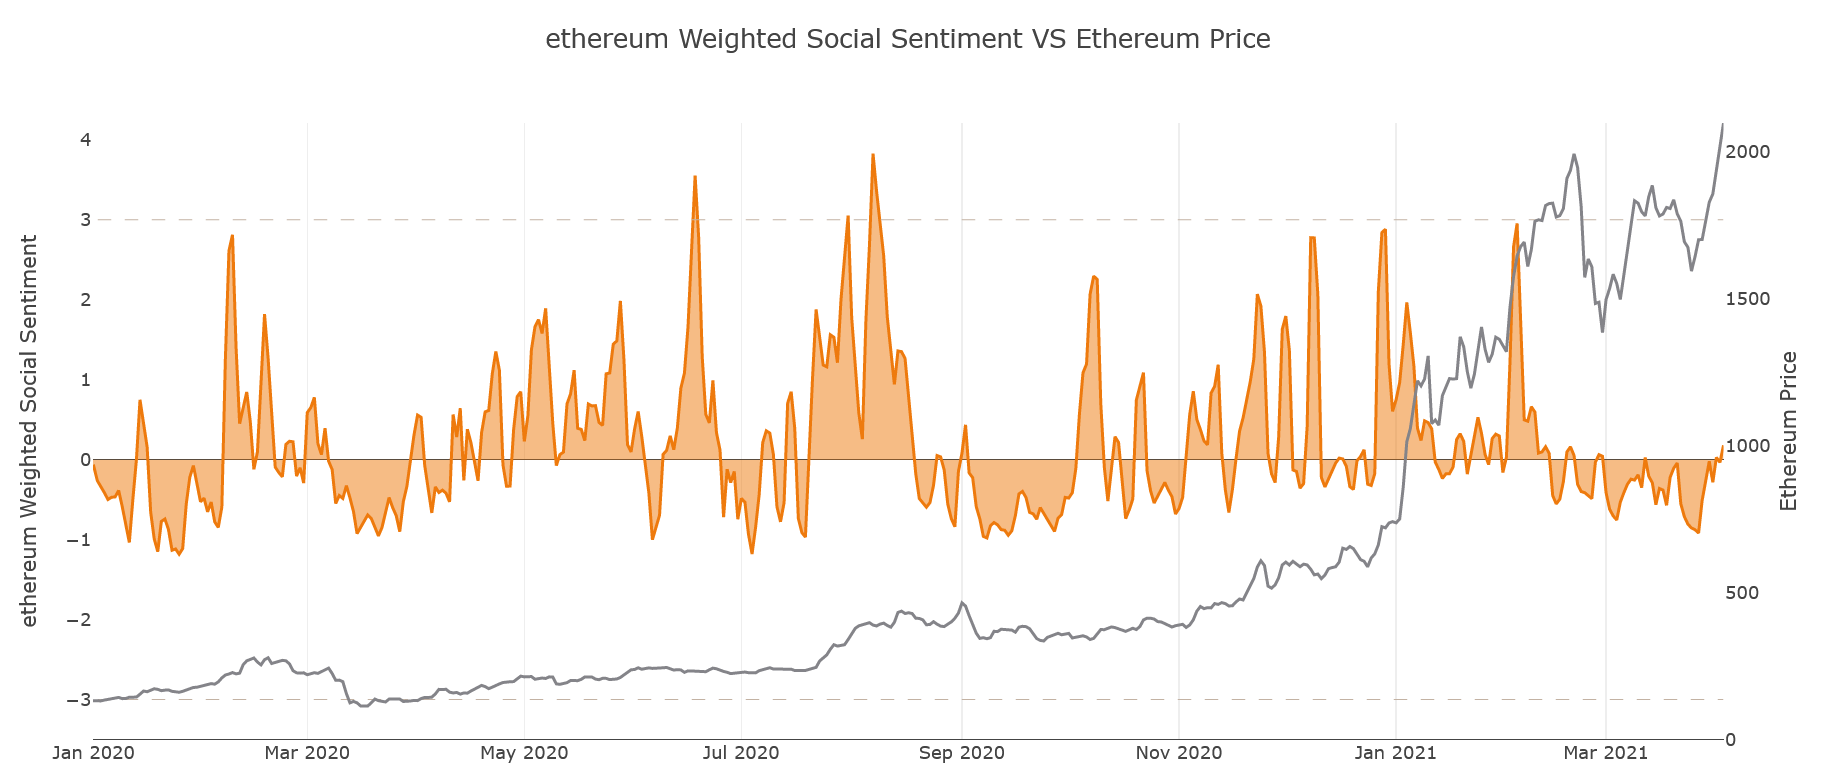
Source: Sanbase
An FXStreet article on March 31 highlighted the symmetrical triangle pattern and commented that the consolidation was nearing completion. The resulting upswing generated a 14% gain over three days and secured an all-time high.
Moving forward, ETH is quietly consolidating the breakout along the previous all-time high from February at $ $2,041.42. All-time highs can be a challenge, and the back-and-forth price action may continue in the short-term, but if the altcoin remains above the symmetrical triangle, the bullish outlook remains in play.
Upside targets begin with 1.382 Fibonacci extension level at $2,327.41 followed by the 1.618 extension level at $2,504.09. The measured move of the symmetrical triangle is slightly above at $2,559.25.
In percent terms, a rally to $2,559.25 would be a 37% gain from the breakout at $1,872.51 and a 22% gain from the current price.
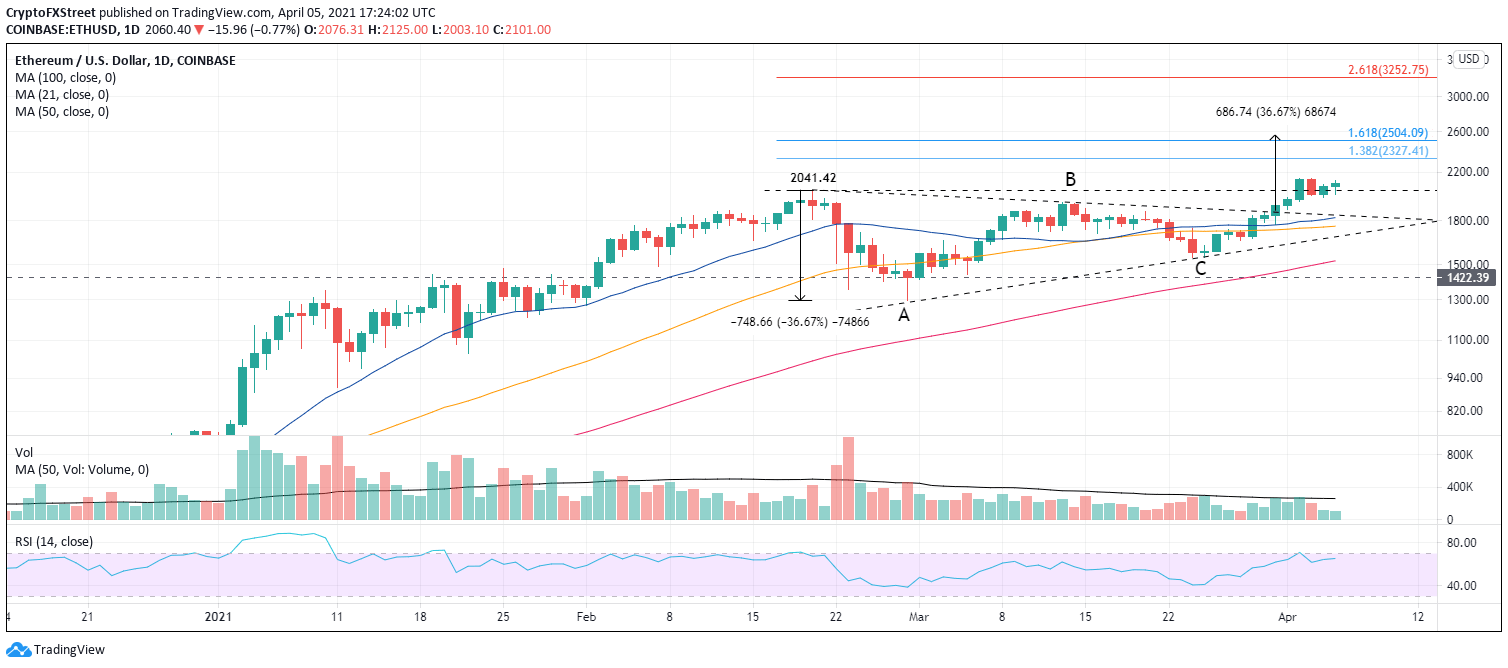
ETH/USD daily chart
If ETH fails, the first significant support is the 50-day simple moving average (SMA) at $1,759.63, followed by the rising trendline of the symmetrical triangle at $1.679. Additional support surfaces at the 100-day SMA at $1,525.77.
It should be noted that the monthly Relative Strength Indicator (RSI) has reached the same overbought level as at the peak in 2018.
Author

Sheldon McIntyre, CMT
Independent Analyst
Sheldon has 24 years of investment experience holding various positions in companies based in the United States and Chile. His core competencies include BRIC and G-10 equity markets, swing and position trading and technical analysis.


