Ethereum Price Forecast: ETH targets $2,400 before facing next hurdles
- Ethereum price quickly recovered 18% from a market-wide crash on June 22.
- The 200-day SMA has acted as significant support for ETH.
- Ethereum price action sees multiple obstacles ahead although the downtrend is in retreat.
- Recent buy signal has confirmed the asset’s recovery to the upside.

Ethereum price made a lower low on June 22, plunging below the $1,732 mark recorded amid the May market crash. While ETH price action followed the leading cryptocurrency as it faced recent negative news headlines, including China’s ban on digital assets, the second-largest crypto is heading for a swift recovery.
Ethereum price bounces back from free fall
Ethereum price fell in tandem with the leading cryptocurrency yesterday and proceeded to record a new low at a level not seen since March at $1,700.
Ethereum has broken down below the symmetrical triangle pattern on the daily chart that started forming on May 20. While the chart pattern indicates that ETH is indecisive, a break below the lower ascending trend line on June 18 confirmed that it was at risk of heading lower.
Ethereum price has plunged below the critical demand barrier that extends from $1,939 to $2,143 but has now managed to sustain trading above the 200-day Simple Moving Average (SMA) that currently acts as significant support.
Further, Ethereum was also saved by a buy signal presented by the Momentum Reversal Indicator (MRI) on the June 22 daily candle, indicating a trend reversal. Adding credence to the bullish thesis is the fact that this was a doji candlestick, giving the impression that ETH is expecting to reverse a period of underperformance.
Currently, Ethereum still has a few resistance levels to reach before overcoming the prevailing bearish trend.
While ETH has been able to trade above the 200-day SMA, and the lower band of the demand zone, the asset needs to target and trade above the $2,143 resistance level to confirm accelerating interest.
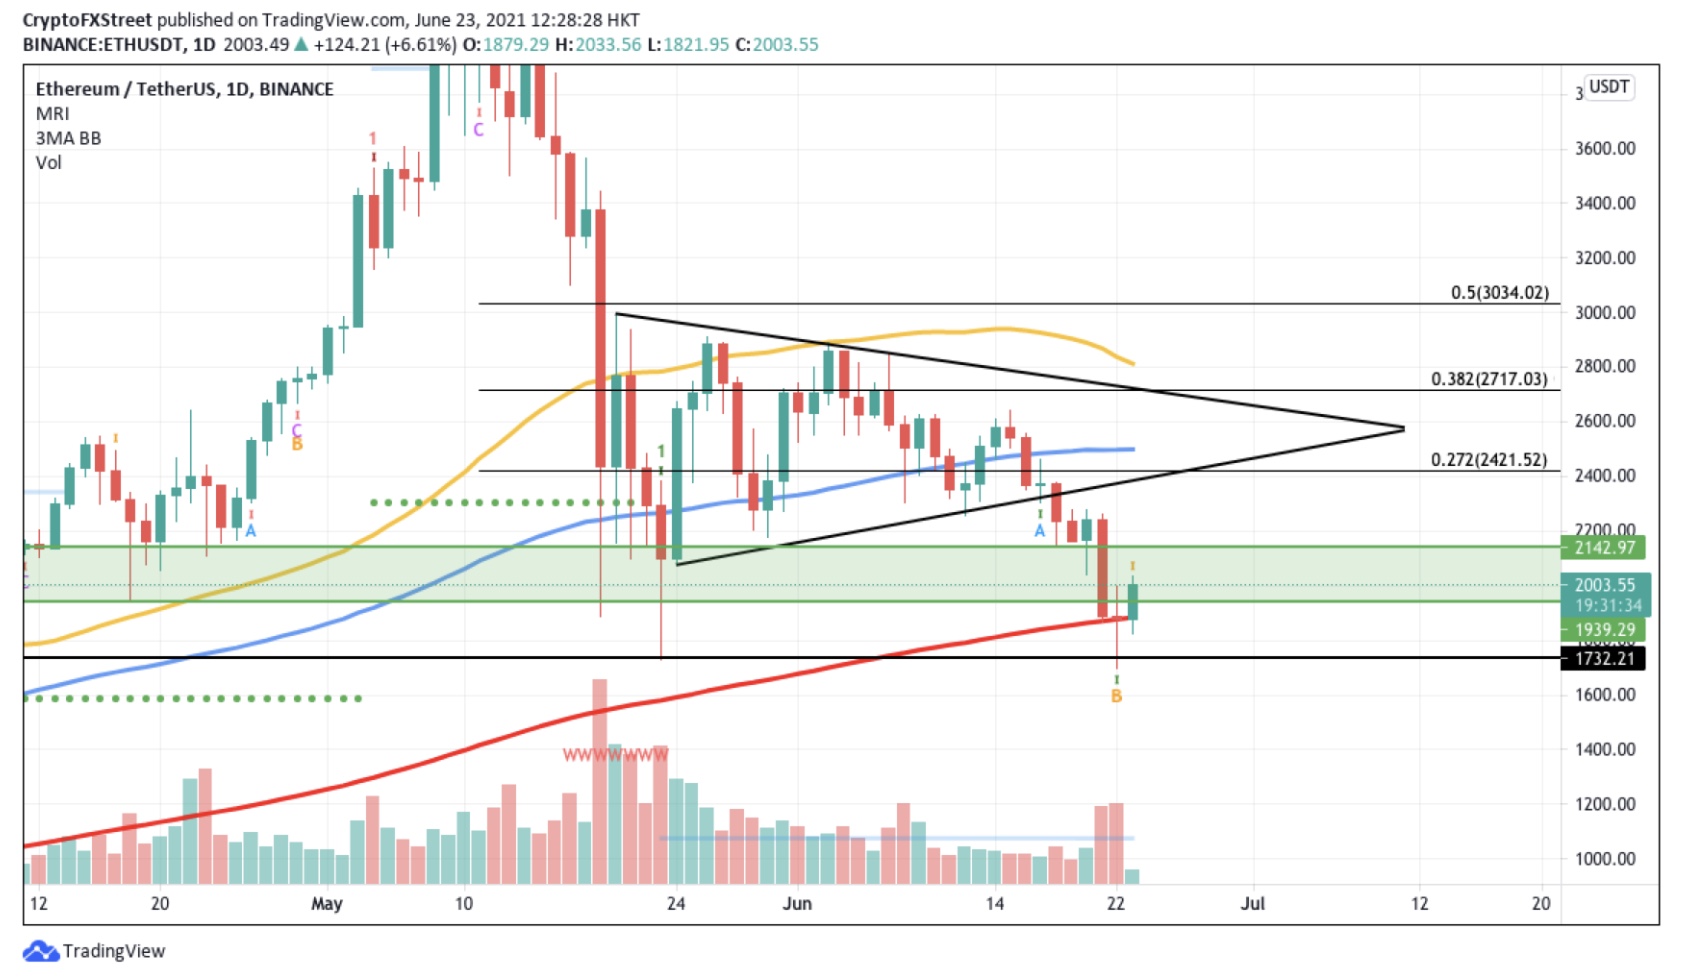
ETH/USDT daily chart
Should Ethereum price be able to hold above the demand barrier as support, bullish investors can expect ETH to target the ascending trend line of the symmetrical triangle, generating a 19% rally from the current price, and the 27.2% Fibonacci extension level at $2,422.
If ETH bulls lift prices higher against the overpowering distribution of the sellers, speculators could expect Ethereum price to tag the 100-day SMA at $2,500 as the next bullish target.
However, if selling pressure continues to materialize for Ethereum, it could retest the 200-day SMA as support before ETH loses further momentum to revisit the May 23 low if the bears manage to ruin the bullish outlook.
Author

Sarah Tran
Independent Analyst
Sarah has closely followed the growth of blockchain technology and its adoption since 2016.



