Ethereum price forecast, a $2,000 revisit, the Merge and ETH blockchain vulnerability
- Ethereum price struggles around the $1,730 support level after a 25% ascent.
- A revisit of the $2,000 psychological level on the back of the Merge hype seems plausible.
- A daily candlestick close above $2,034 will create a higher high and invalidate the bearish thesis

Ethereum price is retesting the recent flipped significant support level and could potentially rally much higher before taking a U-turn. This countertrend movement could be attributed to the hype around the upcoming software upgrade to ETH’s beacon chain, termed the Merge.
An anonymous developer revealed that the Ethereum blockchain wil become vulnerable around the time of Merge, which is scheduled to occur in under three days. The developer adds,
If you control two consecutive blocks, you can start an exploit on block N and finish it on block N+1 without having any arbitrage bot coming in and fixing the price that you have manipulated in between.
Regardless, Ethereum price looks strong from a technical perspective while altcoins show weakness. Investors need to prepare for more volatility over the next 24 hours potentially due to the impact of the inflation data announcement on September 13.
Ethereum price waits for an opportune moment
Ethereum price followed Bitcoin’s path and rallied 25% in roughly two weeks. Interestingly, the return over the aforementioned period for ETH was higher than Bitcoin. During its ascent, ETH flipped the $1,730 resistance level into a support floor in an attempt to retest the imbalance at $1,820, or Fair Value Gap (FVG), as it is also known.
However, it fell short and is currently undergoing a minor retracement. Investors should note that with the Merge, scheduled in under three days, there might be a quick resurgence in buying pressure.
In such a case, investors should consider the possibility of ETH disagreeing with the larger market trend and revisiting the $2,000 psychological level. This move could potentially form a local top for ETH and trigger the start of a downtrend.
Based on the current price action, a breakdown of the $1,730 barrier could result in a straight drop to $1,290, which is a significant support level.
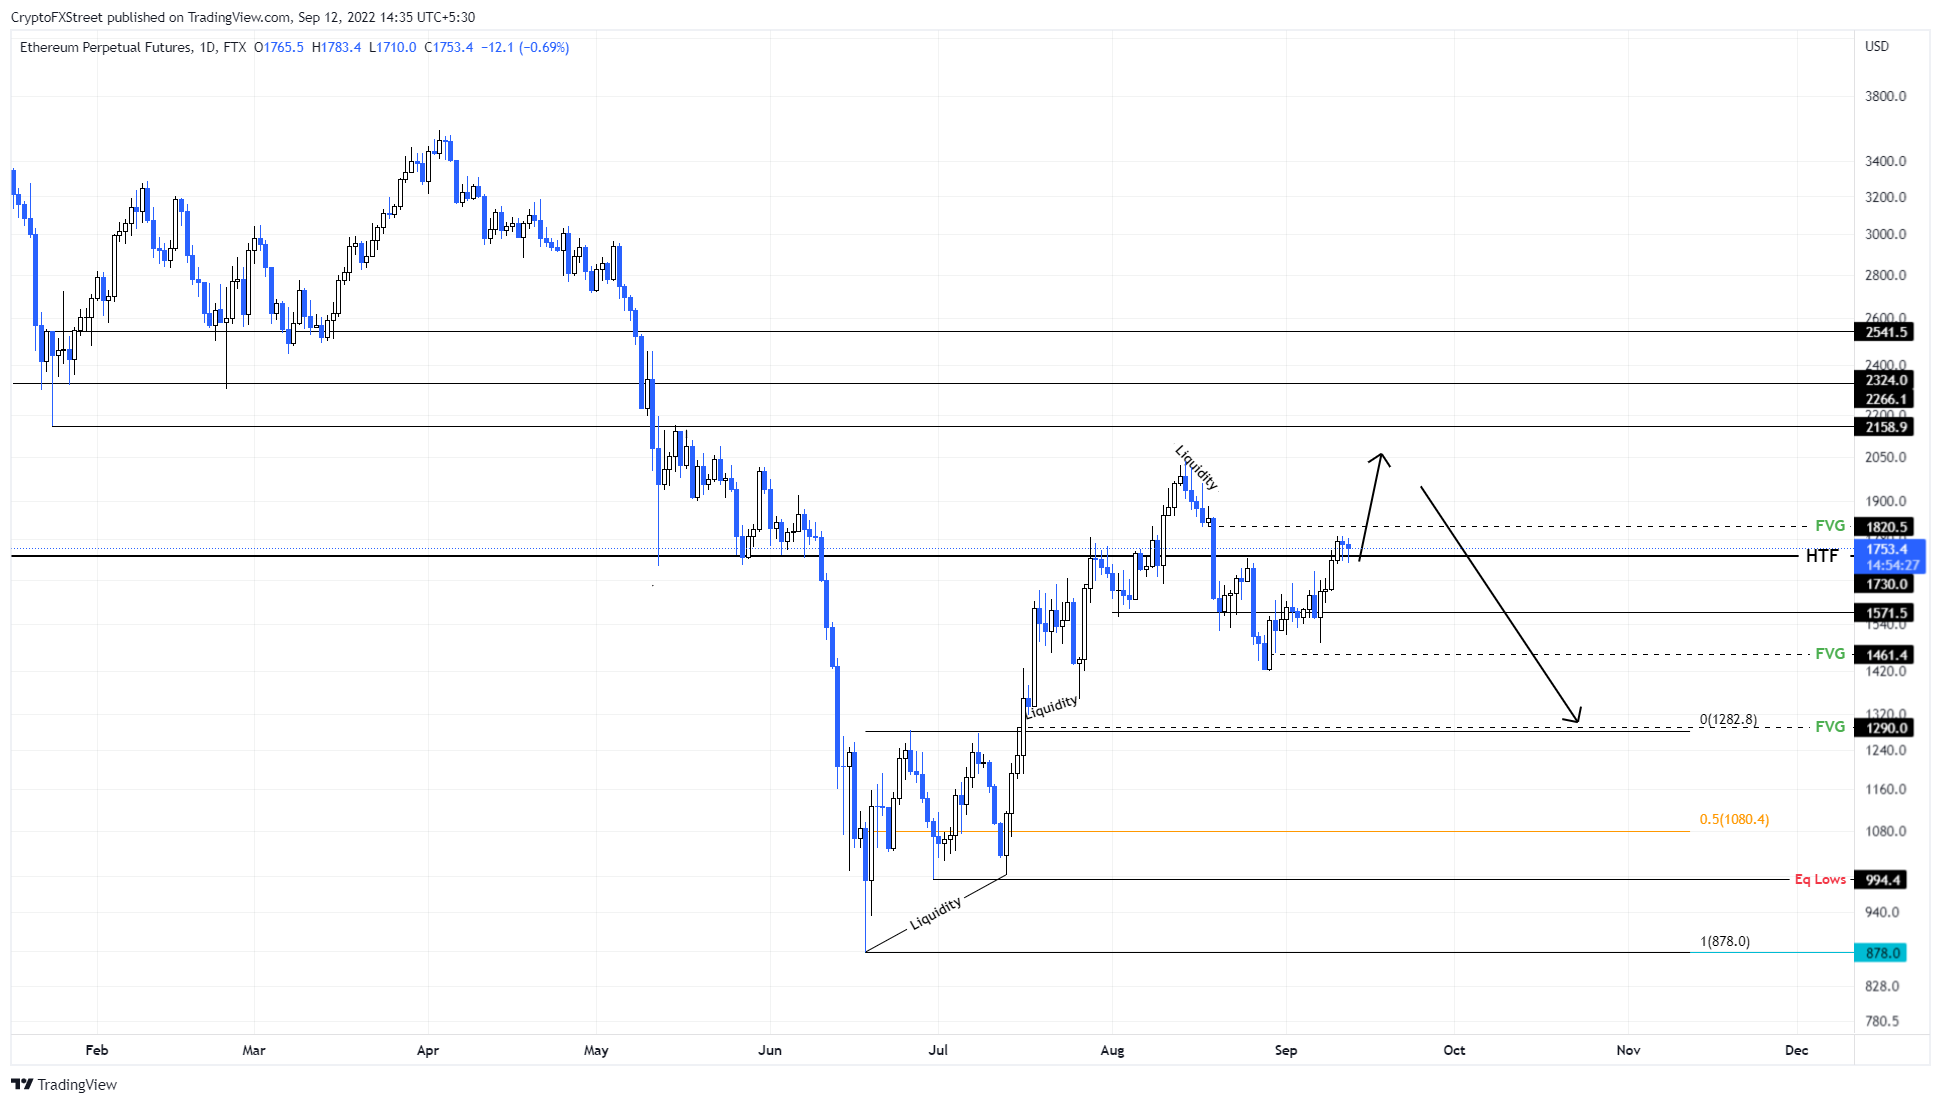
ETH/USD 1-day chart
While things are not looking so good for Ethereum price, a daily candlestick close above $2,034 will create a higher high and invalidate the bearish thesis. This development could see ETH revisit the $2,200 and $2,500 hurdles, respectively.
Author

Akash Girimath
FXStreet
Akash Girimath is a Mechanical Engineer interested in the chaos of the financial markets. Trying to make sense of this convoluted yet fascinating space, he switched his engineering job to become a crypto reporter and analyst.



