|

Ethereum price defends key level which could push the digital asset into new all-time highs

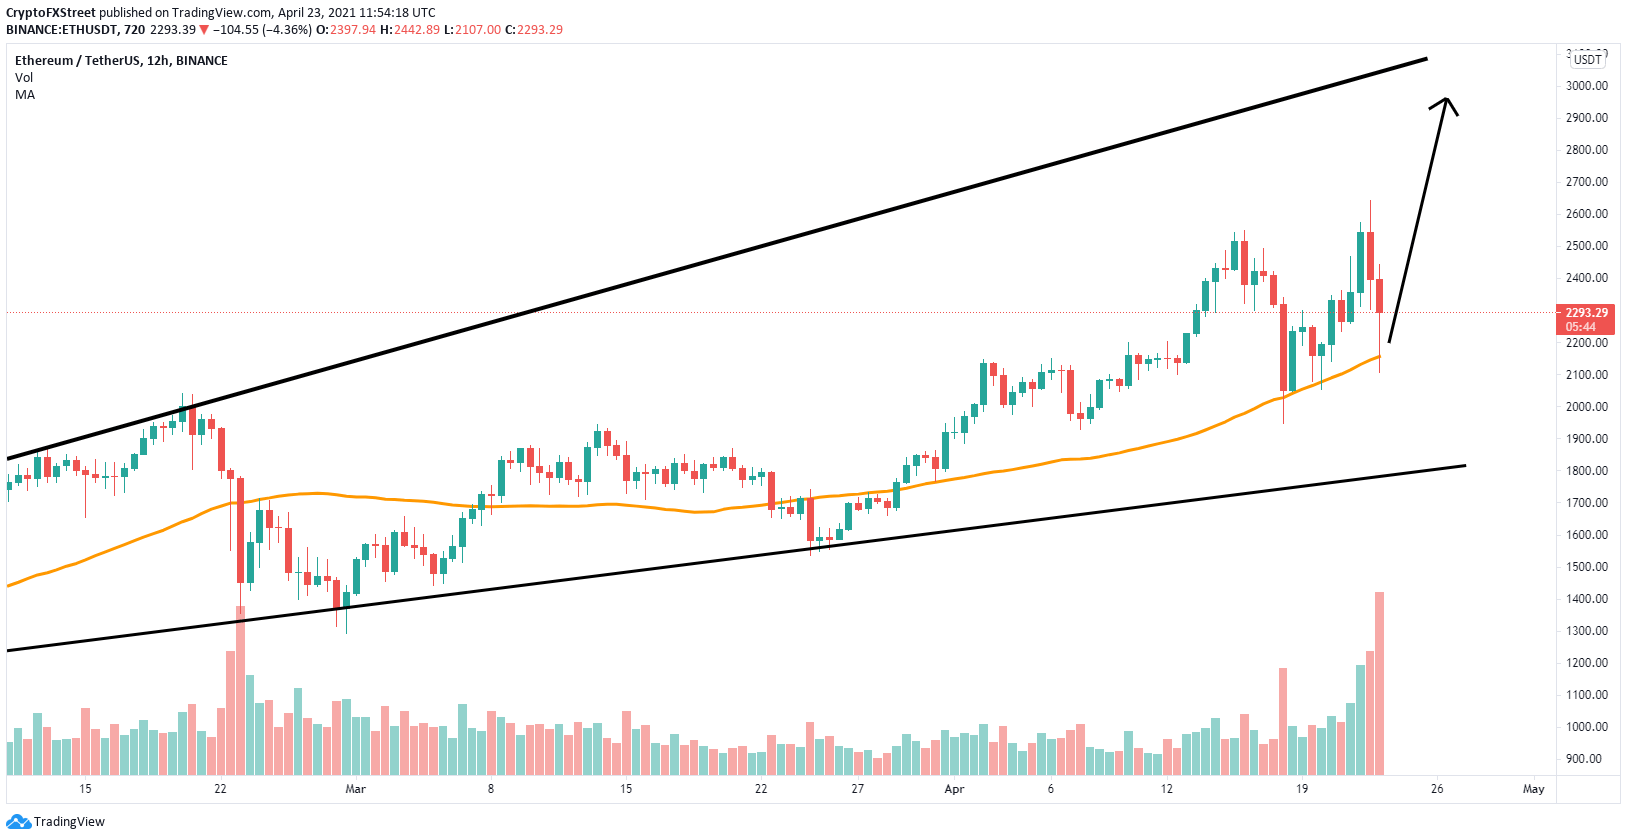
  • Ethereum price remains bounded inside an ascending broadening wedge pattern on the 12-hour chart.
  • The digital asset defends a key support level on the 12-hour chart in the form of the 50 SMA. 
  • The entire cryptocurrency market has seen a significant crash in the past week.

Ethereum just established a new all-time high at $2,644 on April 22, but the entire market had a flash crash in the last 24 hours and ETH also dropped to a low of $2,107. 

Ethereum price defends key level and aims for a rebound

On the 12-hour chart, Ethereum price has managed to stay above the 50 SMA support level at $2,157 and aims for a rebound into new all-time highs. The upper boundary of the ascending broadening wedge pattern is located at $3,000.
eth price

ETH/USD 12-hour chart

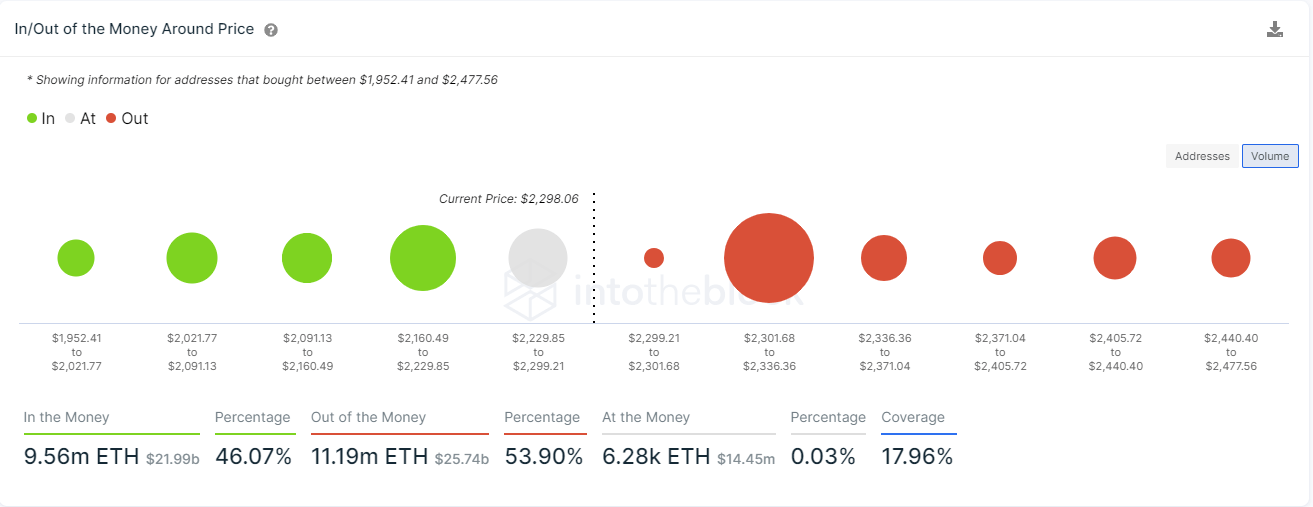
The In/Out of the Money Around Price (IOMAP) chart shows only one crucial resistance area between $2,301 and $2,336 where 35,000 addresses purchased over 8.3 million ETH. A breakout above this range should drive Ethereum price to at least its previous all-time high.
eth price

ETH IOMAP chart

However, at the same time, the IOMAP model also indicates weaker support below. If the area between $2,160 and $2,229 fails to hold, Ethereum price would easily drop toward the psychological level at $2,000. 

Author

Lorenzo Stroe

Lorenzo Stroe

Independent Analyst

Lorenzo is an experienced Technical Analyst and Content Writer who has been working in the cryptocurrency industry since 2012. He also has a passion for trading.

More from Lorenzo Stroe
Share:

Editor's Picks

Zcash Price Forecast: ZEC tests $500 threshold amid risks of a deeper correction

Zcash price hovers around $500 on Friday after five consecutive days of losses, testing a crucial support cluster. The privacy coin holds retail strength, with a positive funding rate despite over $2 million in liquidations over the last 24 hours, suggesting bullish bias persists.

Dogecoin Price Forecast: DOGE eyes $0.065 after breaking key support level

Dogecoin price trades in the red below $0.0700 on Friday, following a 5% drop the previous day. DOGE loses retail strength as broader market speculative demand eases with elevated tensions between the US and Iran. The technical outlook for DOGE points to deeper losses below $0.065.

Cardano Price Forecast: Mixed signals cap ADA recovery

Cardano extends its decline, trading below $0.168 on Friday after facing rejection at the 50-day EMA earlier this week. Mixed derivatives metrics indicate traders' indecision, while neutral momentum indicators suggest ADA lacks a catalyst for a sustained move in either direction. Derivatives data for Cardano show mixed sentiments among traders.

Crypto Market Overview: Bitcoin tests 50-day EMA support – Pi Network and Sky lead losses
The broader cryptocurrency market faces headwinds with rising tensions between the US and Iran, pushing Bitcoin (BTC) down to its 50-day Exponential Moving Average (EMA) support around $65,135 on Friday. Under pressure, Pi Network (PI) and Sky (SKY) emerge as the worst-performing crypto assets over the last 24 hours.
Bitcoin’s potential recovery in the second half hinges on these 4 catalysts
Bitcoin (BTC) has fallen over 34% in the first half of this year as the King Crypto failed to capitalize on a good semester for risk assets despite the woes from the Iran war.

