Ethereum Price Analysis: Whales prepare for ETH 2.0 network upgrade, bulls eye $800
- Ethereum recently launched the Zinken testnet to iron out issues prior to the mainnet launch.
- Number of addresses holding 100,000 - 1 million ETH increased by 13 since mid-July 2020.

The much anticipated Ethereum 2.0 upgrade has faced several challenges and delays, but it looks like they are finally back on track. As previously reported, the smart contract giants previously launched a testnet named “Spadina,” which was supposed to be a “dress rehearsal” for ETH 2.0. However, it had a host of issues with its configurations, which prompted the need for a new testnet.
Zinken, a new shortened testnet, was launched on Monday, October 12, to allow the community validators to iron out issues and give them a chance to test out the genesis process before the mainnet launch.
Developer Terence Tsao tweeted the following about Zinken’s performance after extensively testing it out:
#eth2 Zinken testnet finalized on epoch 2. Almost perfect performance on an incentivized testnet that ran by the community pic.twitter.com/SorSkW5fTR
— terence (@terencechain) October 12, 2020
The technical outlook
Back on September 5, ETH dropped from $390 to $335 and has been trending below the 50-day SMA. Following a lengthy consolidation period, the buyers initiated a rally on October 7 and managed to break above the 50-day SMA on October 11.
ETH/USD daily chart
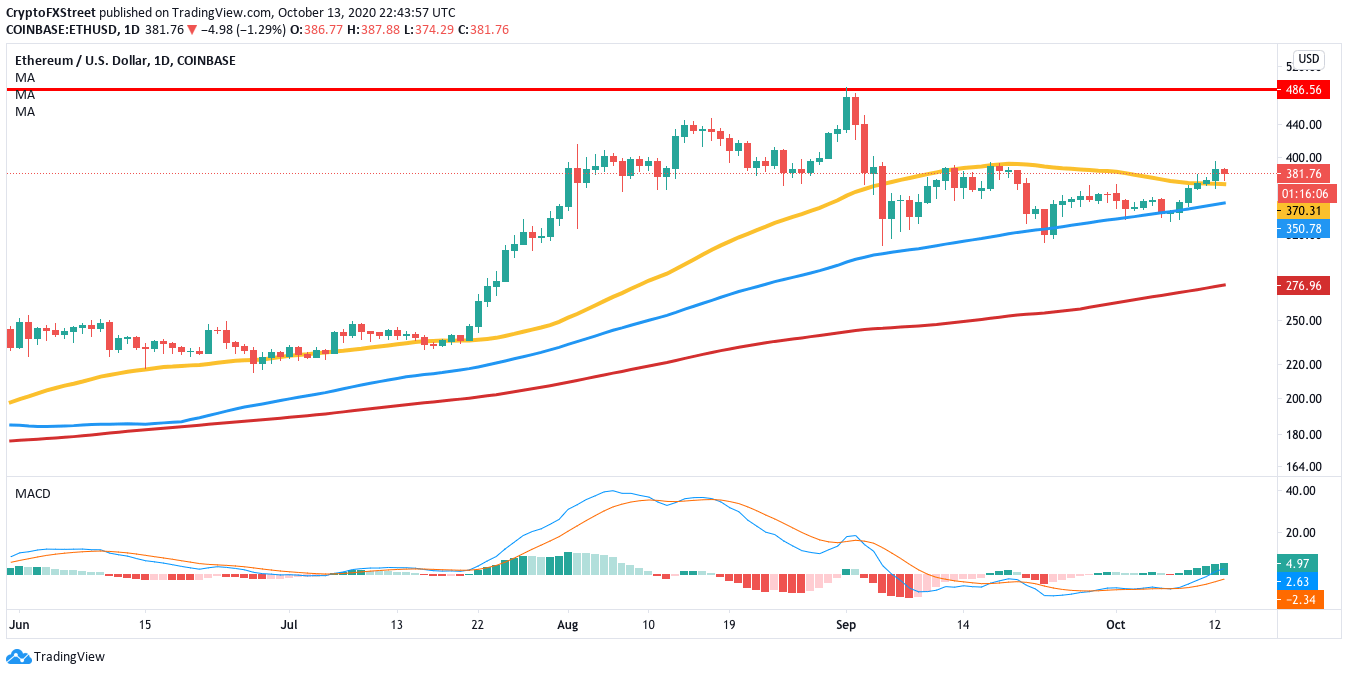
As of now, the second-largest coin by market cap is trading for $380. The MACD shows increasing bullish momentum, which should give the buyers enough firepower to reach the $485 resistance zone.
IntoTheBlock’s “In/Out of the Money Around Price” (IOMAP) further validates the bullish outlook. As per the indicator, the buyers are not going to face any strong resistance levels upfront.
ETH IOMAP
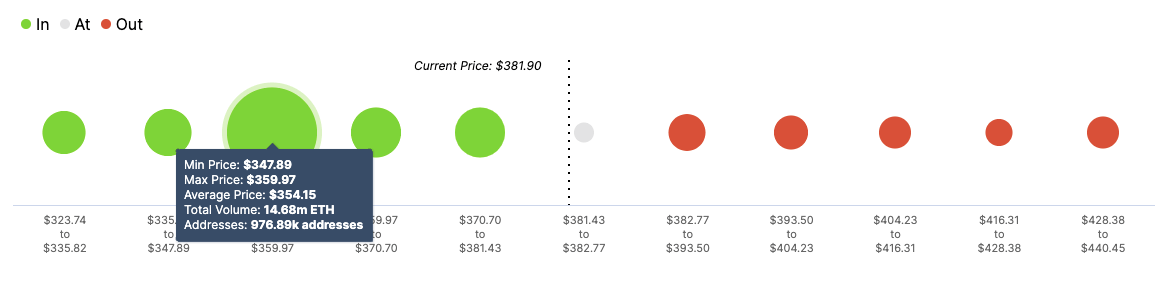
If the bulls manage to retain control, they should be able to enter the $500-area, provided they break past the above-mentioned $485 resistance line. In fact, after studying the weekly ETH/USD chart, it seems like $500 may be an extremely conservative estimate.
ETH/USD weekly chart
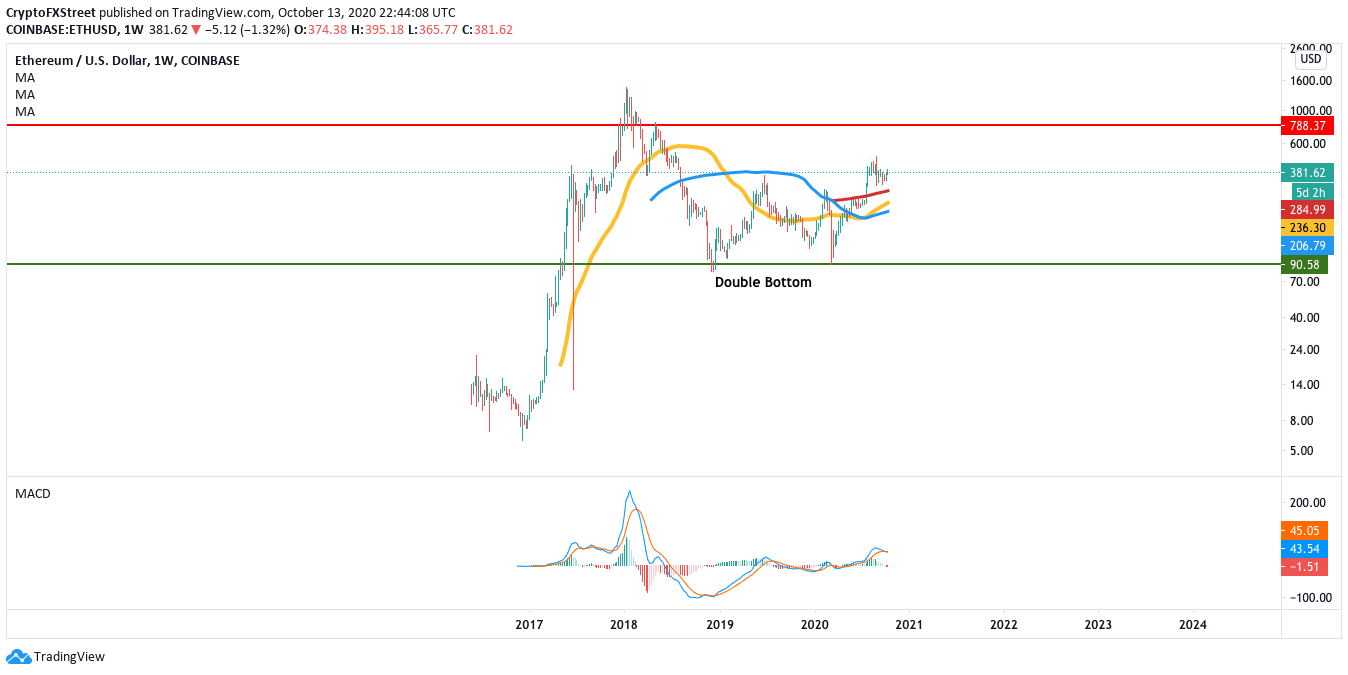
The weekly price has bounced up from the $90 support line forming the double bottom pattern. Technical analysis shows us that the weekly price chart is currently aiming for the $800-zone. It looks like the whales share this bullish hypothesis seeing how they have been on a shopping spree since mid-July.
ETH holders distribution
 [04.39.54, 14 Oct, 2020]-637382291977044090.png)
As per Santiment’s holders distribution, the number of addresses holding between 100,000 - 1 million ETH has gone up by 13, from 153 to 166, since mid-July. This shows a significant spike in buying pressure when you consider that these investors hold between $40 million and $400 million in ETH.
It seems pretty evident that the whales have been consolidating their positions before Ethereum’s transition to ETH 2.0.
The Flipside: Can the bears find an opening?
While the overall outlook looks hugely positive, the bears may still have an opening to take back control of the market. Referring back to the IOMAP, it seems like the most significant support wall lies at the 100-day SMA ($350). Previously, around 975,000 addresses had purchased a little over 14.5 million ETH at this level.
If the sellers take back control and gain enough steam, they should be able to take the price down to the 100-day SMA. However, this support stretch looks strong enough to absorb an immense amount of selling pressure. A break below this will see the price drop to the 200-day SMA ($275).
Key price levels to watch
As of now, the buyers have the license to aim for the $500-zone, having flipped the 50-day SMA from resistance to support. Breaking past the $485 resistance line is critical right now. The weekly chart suggests that a climb to $800 could be on the cards, as well.
The bears' downside is capped off at the 100-day SMA ($350), which is the healthiest support level, as defined by the IOMAP.
Author

Rajarshi Mitra
Independent Analyst
Rajarshi entered the blockchain space in 2016. He is a blockchain researcher who has worked for Blockgeeks and has done research work for several ICOs. He gets regularly invited to give talks on the blockchain technology and cryptocurrencies.



