Ethereum price analysis: Indecisive bulls, directionless bears
- Formation of Doji, indecisiveness visible.
- Could it be early sign of reversal?

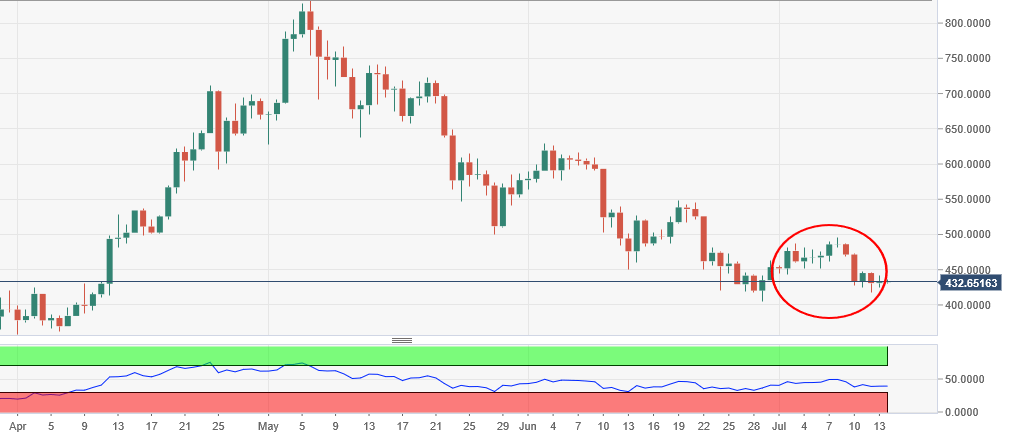
Ethereum, the second largest cryptocurrency by market capitalisation, has formed a doji on the charts, a sign of indecisiveness among the bulls and as well as bears, which is also a sign of exhaution and consolidation.
ETH/USD is trading flat on day at $432.638 and in a narrow trading band of $430 - $435, just about one percent - clear sign of no direction. Formation of doji chart pattern on Friday and throughout last week, is a sign that neither bulls nor bears are sure of the future direction of this crypto.
Although, this formation is also a sign of continuation of trend, but given that this price correction has been going on for months, chances of a reversal from here can't be ruled out.
ETH/USD daily chart:
Author

Manoj B Rawal
Independent Analyst
Manoj B Rawal, financial markets professional with about 11 years of experience in writing, editing and advising on stocks, currencies and fixed income.


