Ethereum price analysis: ETH/USD vigilance as daily candlestick has pierced rising wedge pattern, a close below could be catastrophic, with $300 as a possibility
- Rising wedge pattern breached on the daily for ETH/USD, but a close below is key for further downside.
- Support within the near-term for Ethereum seen at $628, should the price lose further ground and close below $700 area.

The Ethereum price on Tuesday is trading down 1.8%, as the market continues to bearish theme. Across the board, there appears to be little in the way of signs that the selling pressure will ease, with key levels being penetrated.
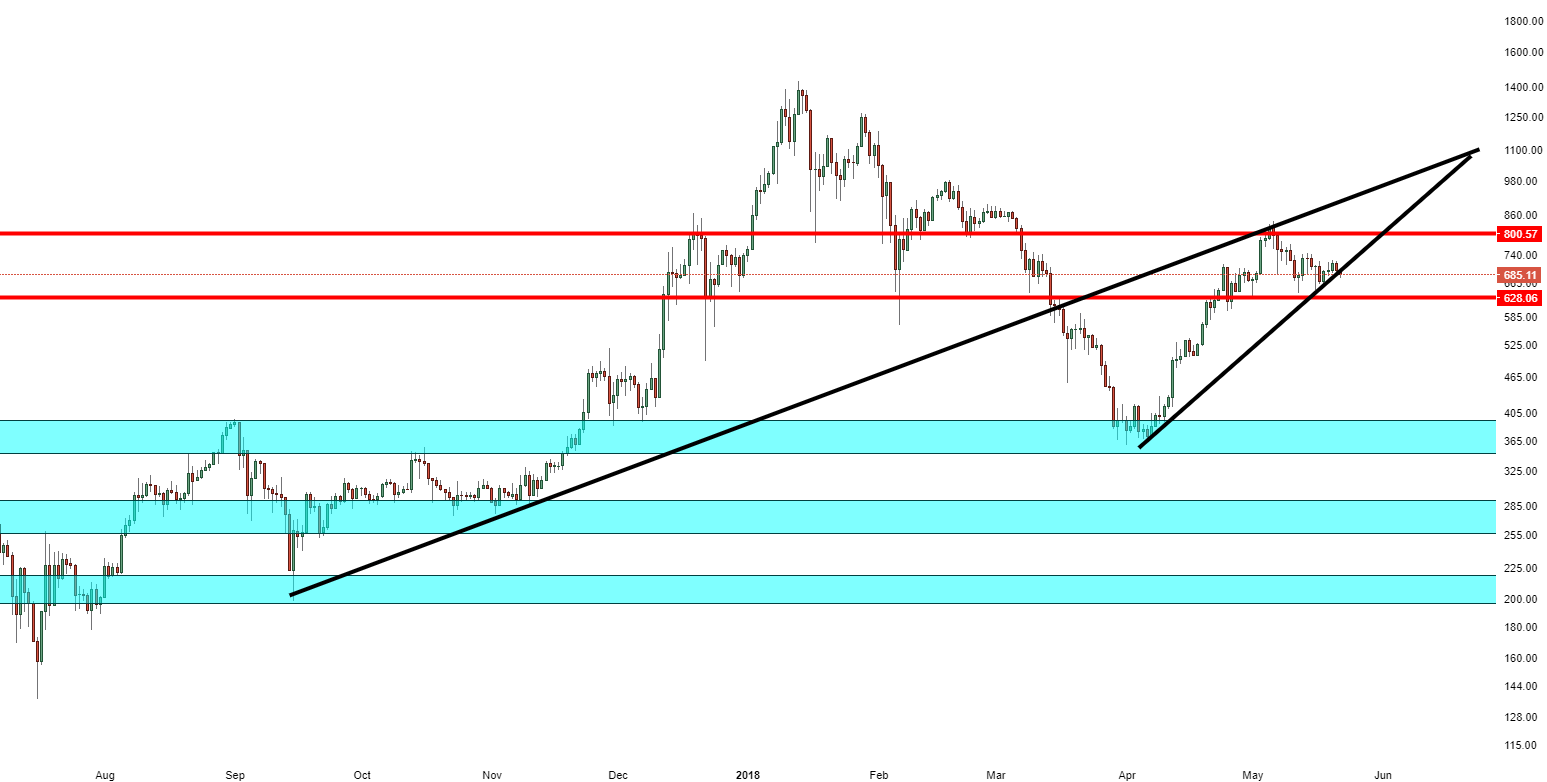
ETH/USD over the past couple of weeks, has formed a rising wedge pattern as seen on the daily frame, the candlestick has seen the price breaching the lower trend line of the mentioned pattern. Should ETH/USD close below, which is around $700, then this could open the door to further downside.
Technically, support in the near-term is seen at $628, where the price has been supported on several occasions already this year. A further breach could see a substantial drop back down to the $300 region, the price was last here on 9th April. Resistance to the upside is strong between $800-900, there is much in the way of a retest for $1,000.
ETH/USD daily chart
Author

Ken Chigbo
Independent Analyst
Ken has over 8 years exposure to the financial markets. He started his career as an analyst, covering a variety of asset classes; forex, fixed income, commodities and equities.


