Ethereum price analysis: ETH/USD re-enters $200-zone
- Latest price session crosses past the resistance offered by the SMA 200 curve.
- Elliot oscillator has had a bullish session after seven straight bearish sessions.

This Sunday, the ETH/USD price session has had a bullish breakout from the flag formation. This Monday has carried forward the bullish momentum and allowed ETH/USD to get back into the $200-zone. Over the last two days, the price has gone up from $185.65 to $200.75. The hourly chart shows that the price went up to $194.80 to $201.50 within two hours, where it trended horizontally for a bit and fell to $196.35. Since then, the price went back up to $200.75.
ETH/USD daily chart
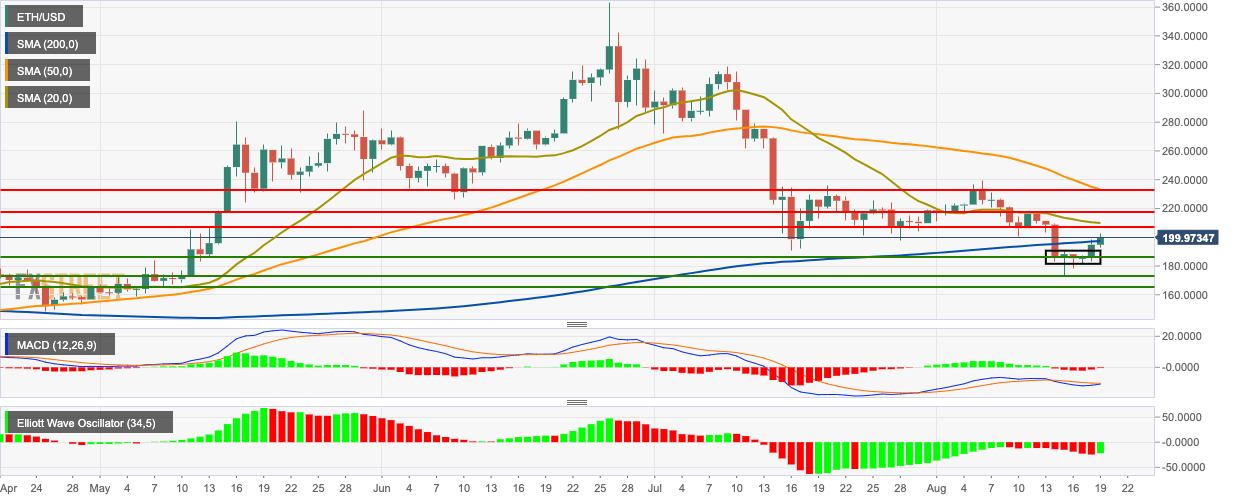
The latest price session has gone past the resistance offered by the 200-day simple moving average (SMA 200) curve. The SMA 50 and SMA 20 curves are still trending above the daily price chart. The moving average convergence/divergence (MACD) indicator shows that market momentum is changing from bearish to bullish. The Elliot oscillator has had a bullish session after seven straight bearish sessions.
Author

Rajarshi Mitra
Independent Analyst
Rajarshi entered the blockchain space in 2016. He is a blockchain researcher who has worked for Blockgeeks and has done research work for several ICOs. He gets regularly invited to give talks on the blockchain technology and cryptocurrencies.


