Ethereum price against Bitcoin not looking this bullish in the last three years
- Ethereum price has exploded and hit new all-time highs on some exchanges, but not all of them.
- The digital asset has greatly outperformed Bitcoin in the past 48 hours.

Ethereum had a nice run-up to its previous all-time high and hit $1,438 on Binance, just $2 away from it. Ethereum is up by more than 11% against Bitcoin and has reached 15% in market dominance, its highest number since August 2018.
Ethereum price outperforms Bitcoin and aims for a new all-time high
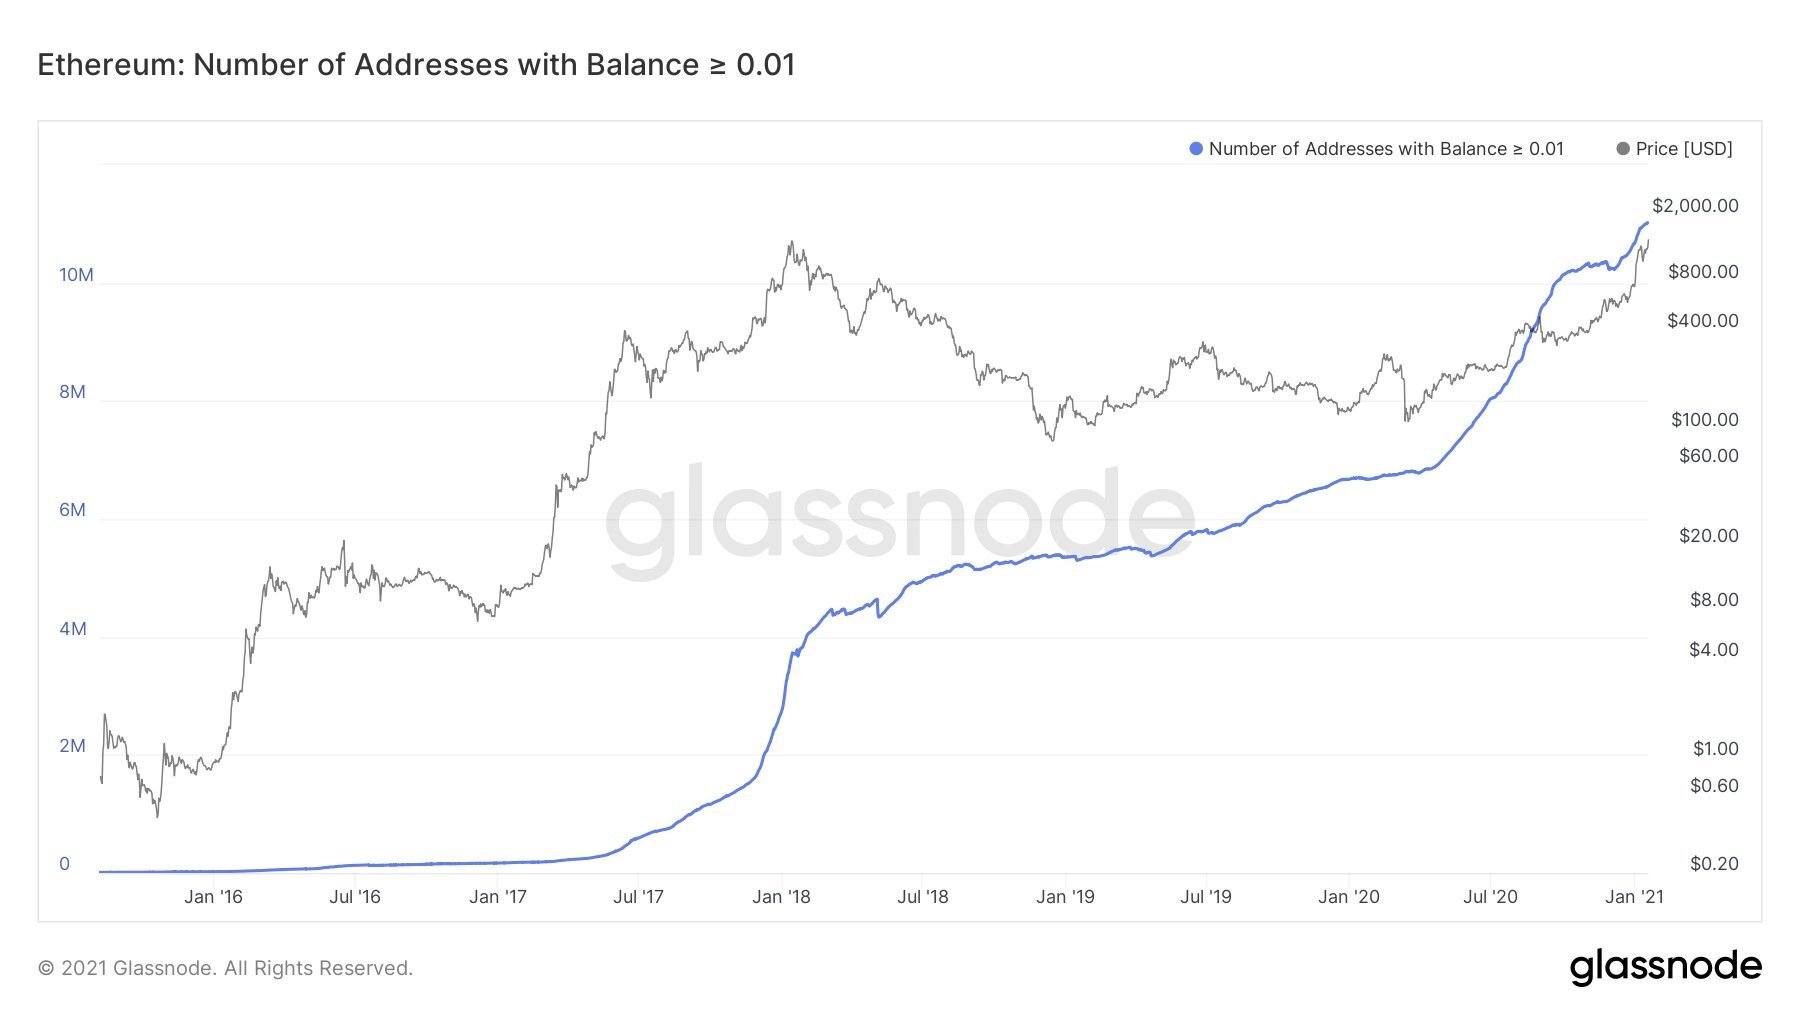
There are many positive on-chain metrics in favor of Ethereum. For instance, the number of active addresses with a balance of over 0.01 ETH continues to grow. Similarly, the Eth2 deposit contract holds more than 2.67 million ETH in total worth more than $3.7 billion at current prices.
Even more fascinating is the number of new whales joining Ethereum. Since January 6, the amount of whales holding between 1,000,000 and 10,000,000 ETH ($1,400,000,000 and $14,000,000,000) has increased by two, which is quite significant.
%20[15.54.00,%2019%20Jan,%202021]-637466654833154264.png)
ETH Holders Distribution chart
Additionally, the number of Ethereum coins inside exchanges has continued to decline since December 17, 2020. This shows again that investors are not interested in selling and expect Ethereum price to rise higher.
%20[15.56.08,%2019%20Jan,%202021]-637466654868624635.png)
ETH Supply on Exchanges
In July 2020, Ethereum managed to beat Bitcoin in daily transaction volume and has consistently increased it more since then. Currently, Ethereum settles around $12 billion in everyday transactions, around $3 billion more than Bitcoin.
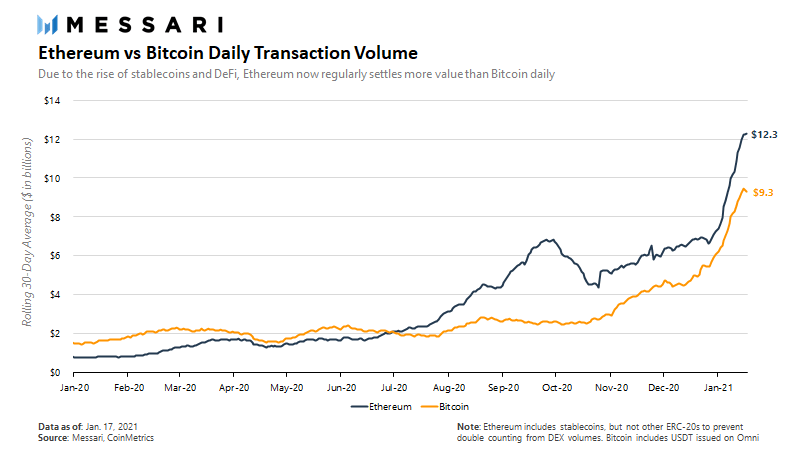
ETH transactions vs Bitcoin
It’s also important to note that ETH Open interest is also at an all-time high with around $4.85 billion in open positions. Increasing open interest basically means that a lot of new money is flowing into the market and should help the present uptrend to continue.
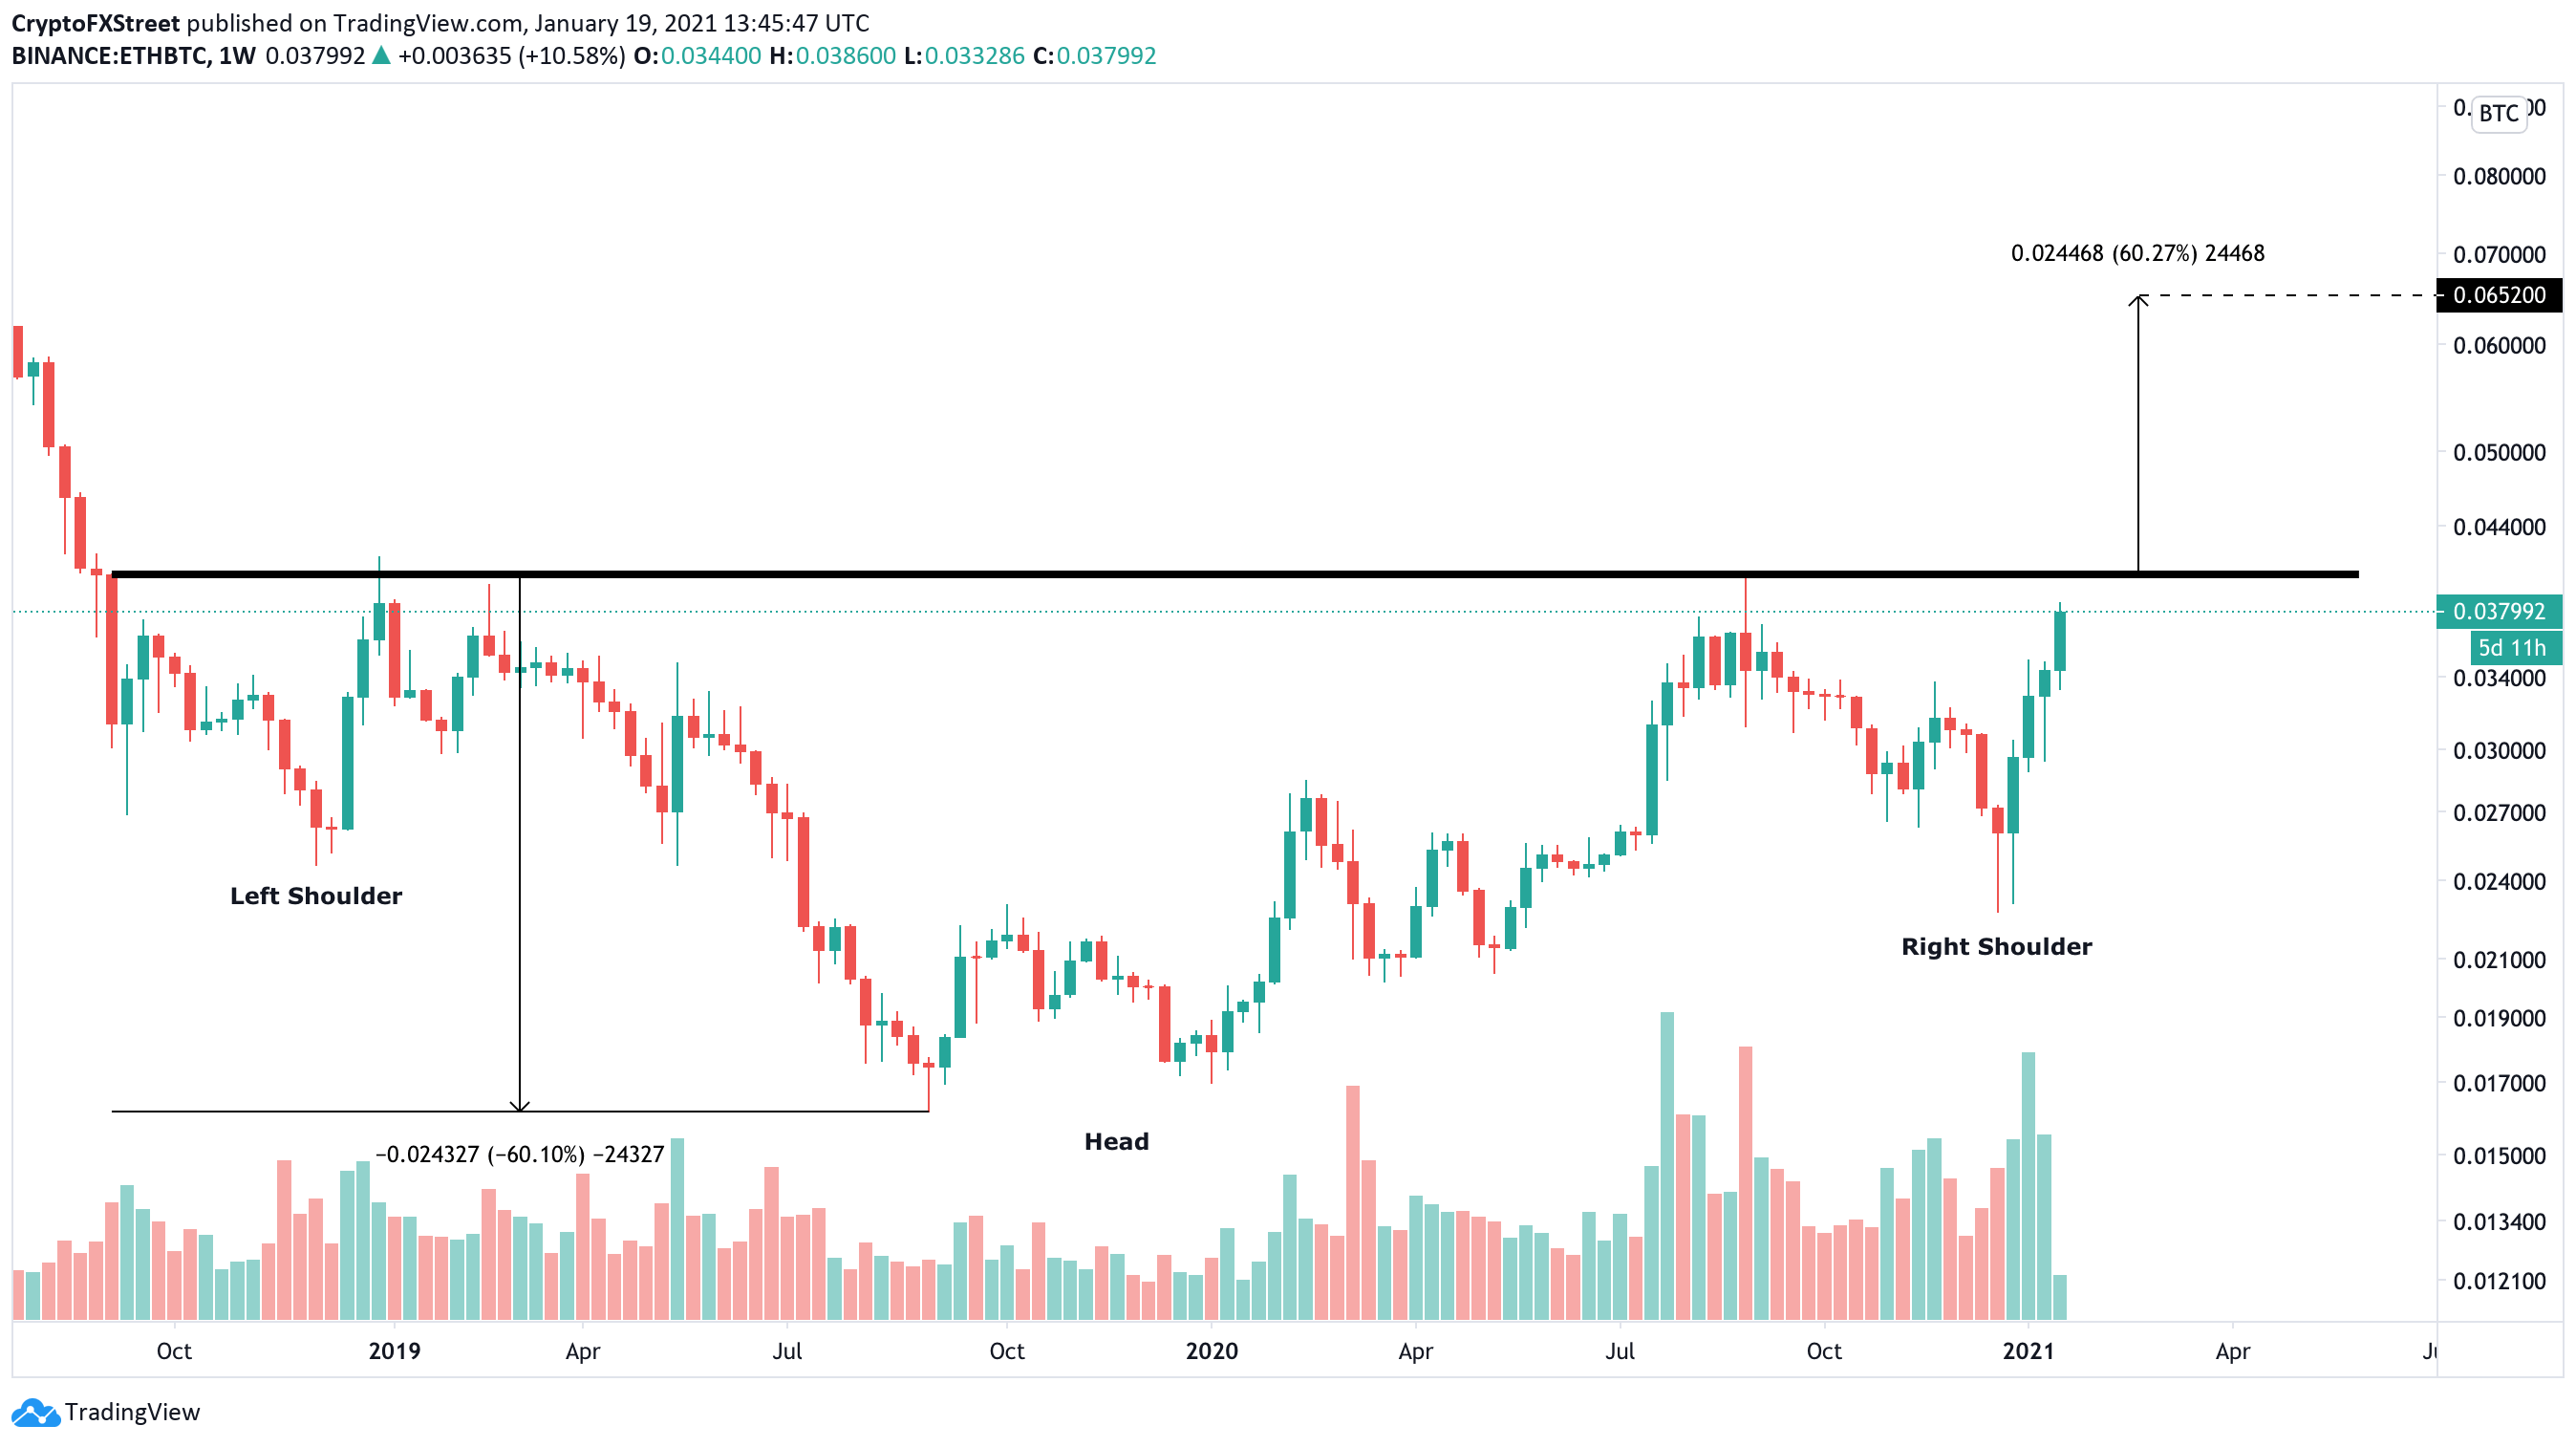
ETH/BTC weekly chart
With this in mind, on the weekly ETH/BTC chart, an inverse head and shoulders pattern seems to have formed which should see a breakout in the short-term pushing Ethereum by 60% to a similar target as the chart above, giving a lot of credence to the bullish outlook. Veteran trader Peter Brandt also thinks the pattern is clear stating:
The ETH/BTC has been systematically forming a massive inverse H&S base since Sep of 2018 as shown on the weekly chart. The current rally has established the right shoulder of the 28-month inverted H&S as a separate inverted H&S with an up-slanting neckline on the daily chart. A decisive close above .04060 would establish a target of .06519
Author

Lorenzo Stroe
Independent Analyst
Lorenzo is an experienced Technical Analyst and Content Writer who has been working in the cryptocurrency industry since 2012. He also has a passion for trading.


