|

Ethereum: Med term breakdown will test long term breakout

  • ETH sitting at key levels, needs a sharp bounce desparately.
  • Break of these levels would be messy and chaotic.

Ethereum, the second largest cryptrocurrency by market capitalisation, after breaking down on the medium term chart, is now sitting exactly at certain key levels, which must hold, or else the breakout that occured last month, may not sustain and the coin may drop back to November lows.

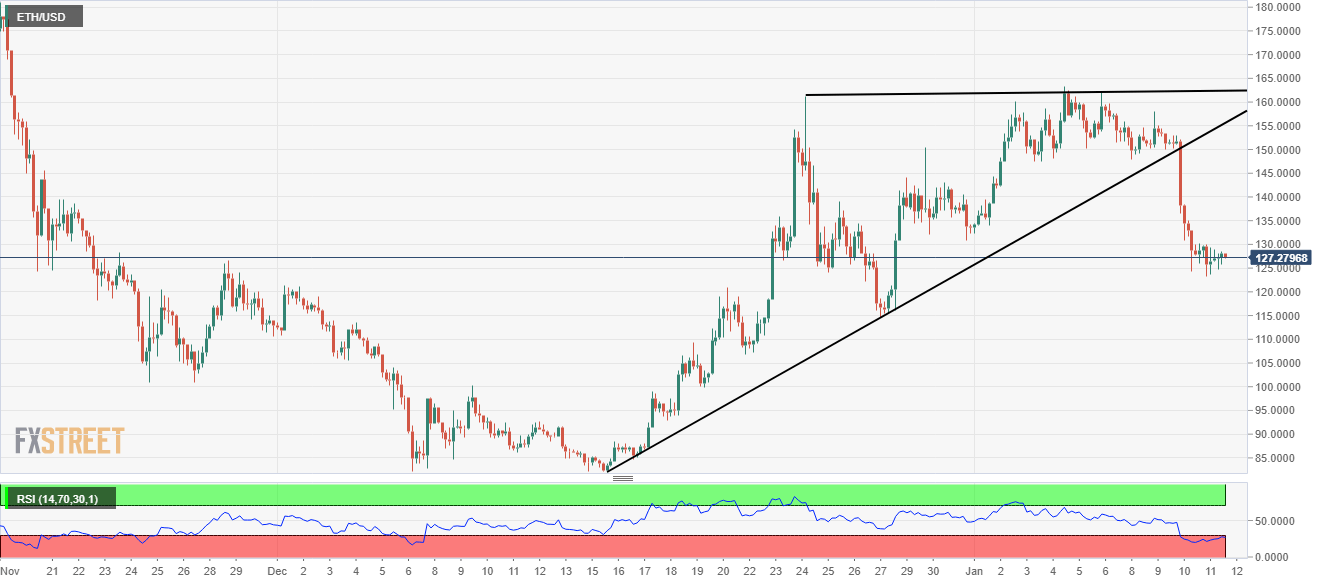
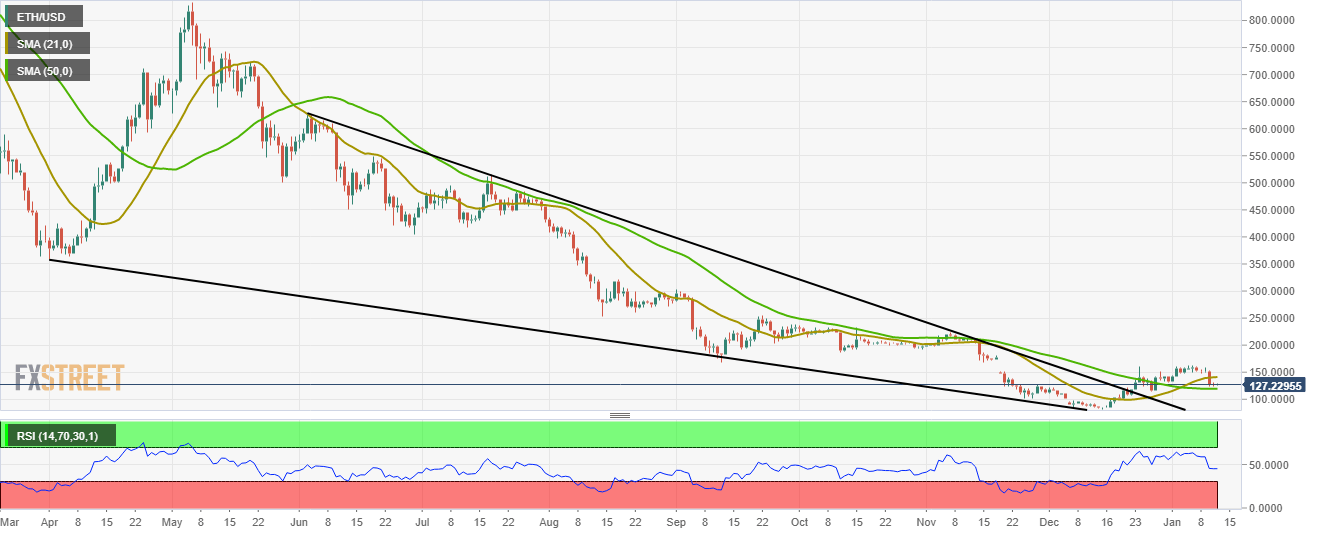
ETH/USD is up about 4 cents of a percent at $127.75 and trading in less than 3 percent on Saturday. On the daily chart, ETH was trading in a downward sloping triangle for all through last year and finally broke out of it, after hitting double digit lows in November. But this breakout did not give enough momentum for the bulls to carry on to, resulting into a short term breakdown on the 240-minute chart, target of which is all the way towards November low and below.

Only solace for the bulls is that the price is sitting exactly above its 50 days simple moving average, break of which would be as messy and chaotic as the last crash was.

ETH/USD 240-minute chart:

ETH/USD daily chart:


Get 24/7 Crypto updates in our social media channels: Give us a follow at @FXSCrypto and our FXStreet Crypto Trading Telegram channel

Author

Manoj B Rawal

Manoj B Rawal

Independent Analyst

Manoj B Rawal, financial markets professional with about 11 years of experience in writing, editing and advising on stocks, currencies and fixed income.

More from Manoj B Rawal
Share:

Editor's Picks

Ripple exposed to volatility amid low retail interest, modest fund inflows

Ripple (XRP) is extending its intraday decline to around $1.40 at the time of writing on Monday amid growing pressure from the retail market and risk-off sentiment that continues to keep investors on the sidelines.

Crypto Today: Bitcoin steadies around $70,000, Ethereum and XRP remain under pressure 

Bitcoin hovers around $70,000, up near 15% from last week's low of $60,000 despite low retail demand. Ethereum delicately holds $2,000 support as weak technicals weigh amid declining futures Open Interest.

Pi Network extends decline as steady mainnet migration adds pressure

PI edges lower by over 3% at press time on Monday, marking a third consecutive day of losses. The declining trend in PI aligns with the steady mainnet migration of PI tokens, which may fuel selling pressure. The technical outlook for PI remains bearish, with bearish momentum persisting. 

Bitcoin slips below $70,000 as ETF outflows, realized losses fuel bearish outlook

Bitcoin price trades in red below $70,000 on Monday after correcting nearly 9% in the previous week. US-listed spot ETFs recorded a $318 million weekly outflow, marking the third consecutive week of withdrawals.

Bitcoin Price Annual Forecast: BTC holds long-term bullish structure heading into 2026

Bitcoin (BTC) is wrapping up 2025 as one of its most eventful years, defined by unprecedented institutional participation, major regulatory developments, and extreme price volatility.

Bitcoin: The worst may be behind us

Bitcoin (BTC) price recovers slightly, trading at $65,000 at the time of writing on Friday, after reaching a low of $60,000 during the early Asian trading session. The Crypto King remained under pressure so far this week, posting three consecutive weeks of losses exceeding 30%.