Ethereum Market Update: ETH contract calls on steroids, price may follow the lead
- The number Ethereum's contract calls skyrocketed to all-time highs amid DeFi boom.
- ETH/USD needs to recover above $400 to mitigate the selling pressure.

Ethereum's collapse gathered pace after the price broke below the critical support level of $400. At the time of writing, ETH/USD is changing hands at $388.79, down nearly 11% from this time on Thursday. The second-largest digital asset recovered from the intraday low of $374.81, but the upside momentum remains weak as long as the price stays below $400.
DeFi boom sends Ethereum's network activity to the moon
The number of internal and external Ethereum (ETH) contract calls has been growing with cosmic speed recently due to the bubbling activity in the decentralized finance (DeFi) space.
According to the statistical data, provided by Glassnode, the number of internal transactions increased by 200% since June. The external activity is also spectacular:
Contract calls initiated by Externally Owned Accounts (EOAs) has almost tripled since the beginning of the year – from less than 300k to currently over 850k per day.
Contract calls are referred to non-transactional function requests from smart contracts. They are used for tests and dry runs before the launch of a smart contract or a project and usually do not clutter blockchain; however, the exponential growth implies that the on-chain activity on the Ethereum blockchain may stay elevated and lead to a significant hike in gas fees.
As the FXStreet recently reported, the DeFi boom has been driving ETH gas prices, or transaction fees to all-time-highs recently. Thus, Ethereum's median fees jumped by over 900% to $8.95 in August, strengthening the case for further ETH price increase, in the long run, provided that the network finds the way to release the pressure.
ETH/USD: The technical picture
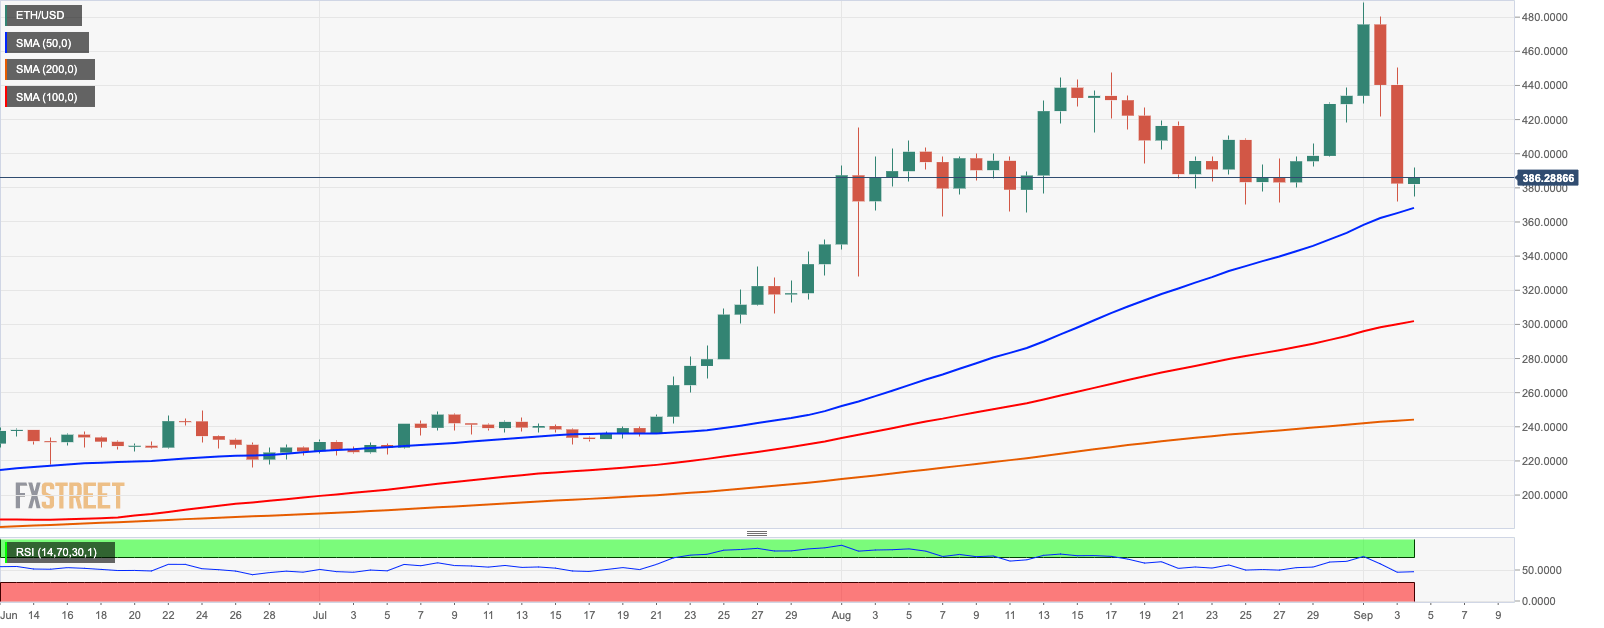
On a daily chart, ETH/USD is still in the bullish trend as long as it stays above the daily SMA50 (currently at $368.30). This technical barrier has been limiting the price decrease since the middle of April, and it may serve as a backstop for ETH during this sell-off episode. If it is broken, the downside momentum may gain traction with the next focus on $300, which is also reinforced by the daily SMA100.
Meanwhile, a sustainable move above $400 will elevate the immediate bearish pressure and bring more bulls to the market. In this case, ETH/USD may quickly regain losses and retest $440. The daily RSI has started to reverse to the upside, which adds credibility to the bull case scenario. Once $440 is broken, ETH/USD will have a good chance to drive prices back to $500.
ETH/USD daily chart
Author

Tanya Abrosimova
Independent Analyst


