|

Ethereum incomplete sequences calling the decline

In this technical blog we’re going to take a quick look at the Elliott Wave charts of Ethereum (ETHUSD). As our members know, ETHUSD is showing incomplete sequences in the cycle from the 3977 peak. We have been predicting a price decline. Recently, we got a bounce against the 3650 peak , after which the price dropped toward new lows as we expected. In the following text, we will explain the Elliott Wave Pattern and the forecast.

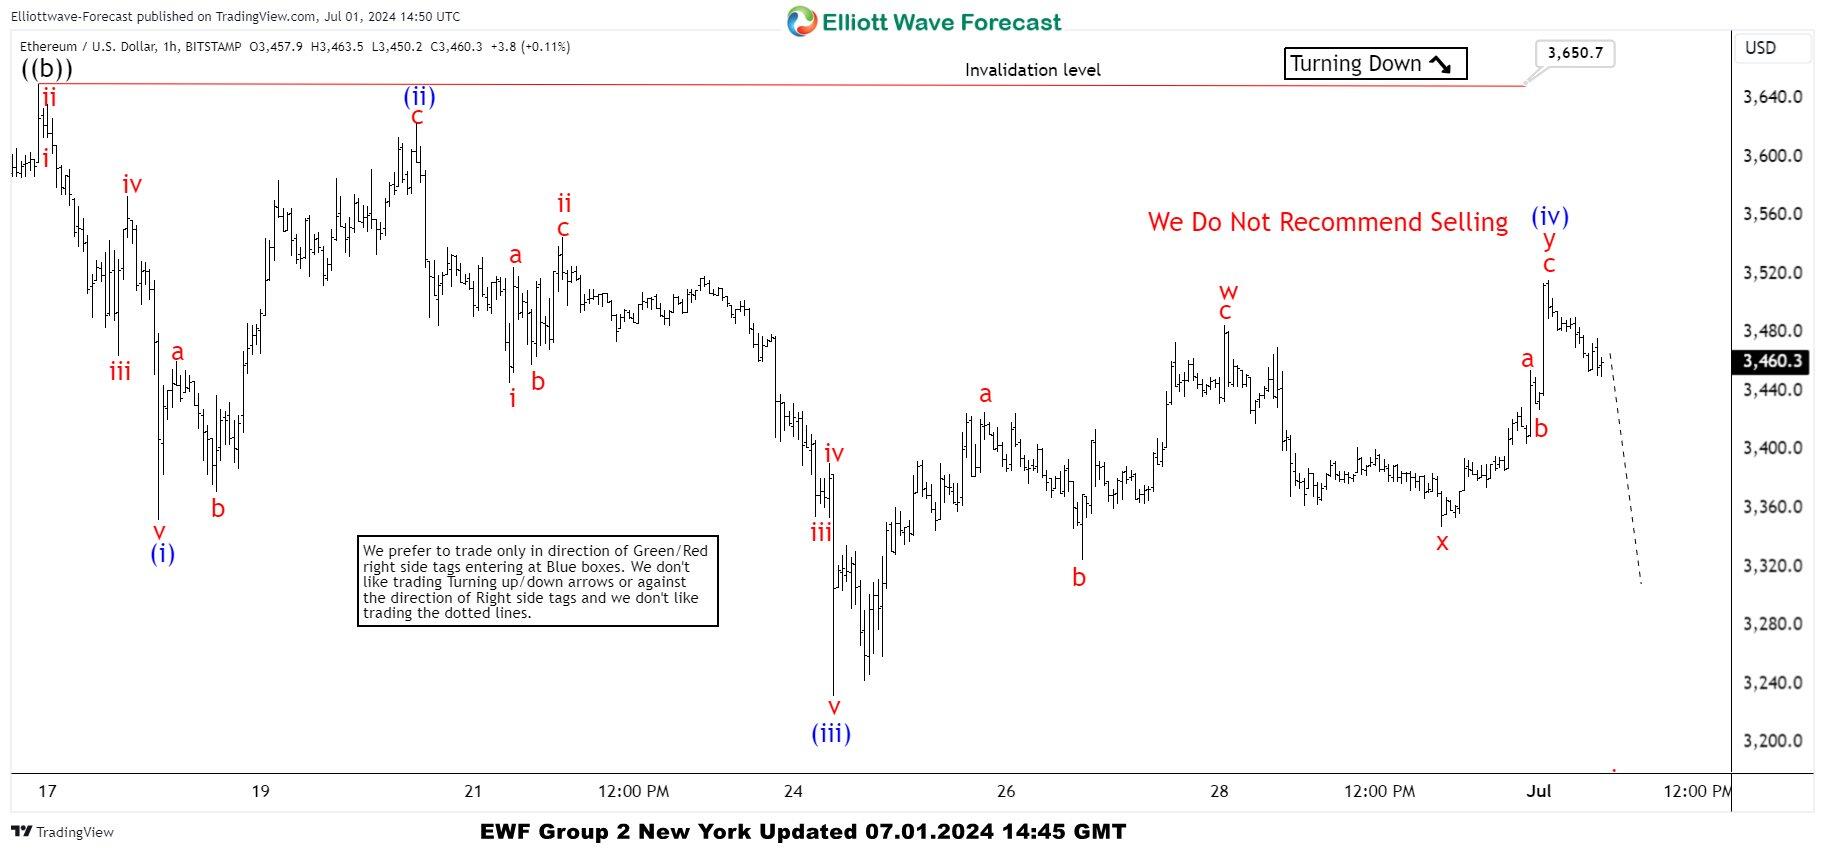
ETH/USD one-hour Elliott Wave analysis 07.01.2024

ETHUSD current view suggests cycle from the 3650 is still in progress as 5 waves structure. We believe wave (iv) blue ended at 3515 high, as labeled on the chart. As far as the price stays below that peak and more importantly below 3650 peak, we expect further weakness in the cryptocurrency to occur. Although overall view is bullish, we don’t recommend buying the cryptocurrency at this stage and expect to see a decline toward new lows ideally.

Chart

Author

Elliott Wave Forecast Team

Elliott Wave Forecast Team

ElliottWave-Forecast.com

More from Elliott Wave Forecast Team
Share:

Editor's Picks

Ripple exposed to volatility amid low retail interest, modest fund inflows

Ripple (XRP) is extending its intraday decline to around $1.40 at the time of writing on Monday amid growing pressure from the retail market and risk-off sentiment that continues to keep investors on the sidelines.

Crypto Today: Bitcoin steadies around $70,000, Ethereum and XRP remain under pressure 

Bitcoin hovers around $70,000, up near 15% from last week's low of $60,000 despite low retail demand. Ethereum delicately holds $2,000 support as weak technicals weigh amid declining futures Open Interest.

Pi Network extends decline as steady mainnet migration adds pressure

PI edges lower by over 3% at press time on Monday, marking a third consecutive day of losses. The declining trend in PI aligns with the steady mainnet migration of PI tokens, which may fuel selling pressure. The technical outlook for PI remains bearish, with bearish momentum persisting. 

Bitcoin slips below $70,000 as ETF outflows, realized losses fuel bearish outlook

Bitcoin price trades in red below $70,000 on Monday after correcting nearly 9% in the previous week. US-listed spot ETFs recorded a $318 million weekly outflow, marking the third consecutive week of withdrawals.

Bitcoin Price Annual Forecast: BTC holds long-term bullish structure heading into 2026

Bitcoin (BTC) is wrapping up 2025 as one of its most eventful years, defined by unprecedented institutional participation, major regulatory developments, and extreme price volatility.

Bitcoin: The worst may be behind us

Bitcoin (BTC) price recovers slightly, trading at $65,000 at the time of writing on Friday, after reaching a low of $60,000 during the early Asian trading session. The Crypto King remained under pressure so far this week, posting three consecutive weeks of losses exceeding 30%.