|

Ethereum (ETH/USD) Elliott Wave: Bullish sequences point to further rally

Hello fellow traders. In this technical article, we are going to present Elliott Wave charts of Ethereum ETHUSD . As our members know, ETHUSD has been showing impulsive bullish sequences in the cycle from the 2,115.6 low, pointing to further strength ahead. We have been calling for a rally in ETHUSD since the beginning of July, based on the higher high bullish sequences the crypto was forming.

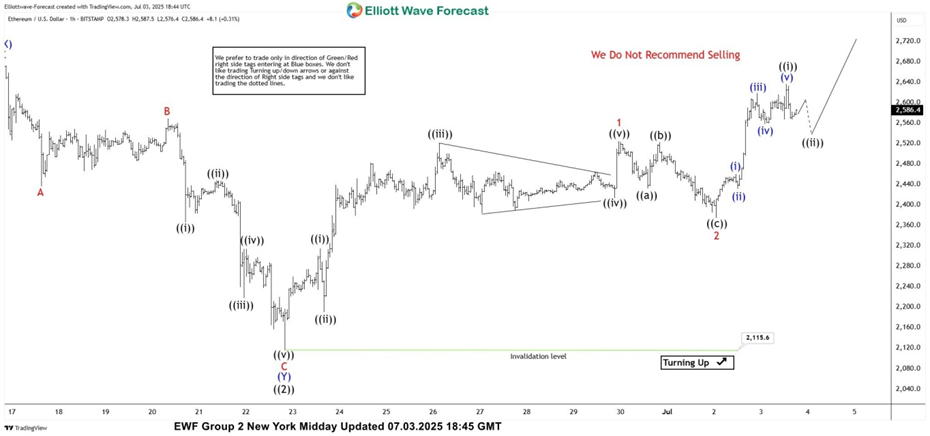
ETH/USD Elliott Wave 1  Hour  Chart 07.03.2025

The current analysis suggests that ETHUSD is trading within the cycle from the 2,115.6 low. The price structure is showing higher high bullish sequences. Intraday pullback 2 is counted as completed at the 2,377.5 low. While price stays above that level, we expect further strength in the crypto, within wave 3 red.

As Elliott Wave practitioners know, wave 3 is usually the strongest wave in an impulsive sequence and often reaches the 1.618–2.618 Fibonacci extension of wave 1. In this case, that projects potential targets in the 3,036.5–3,441.1 area.
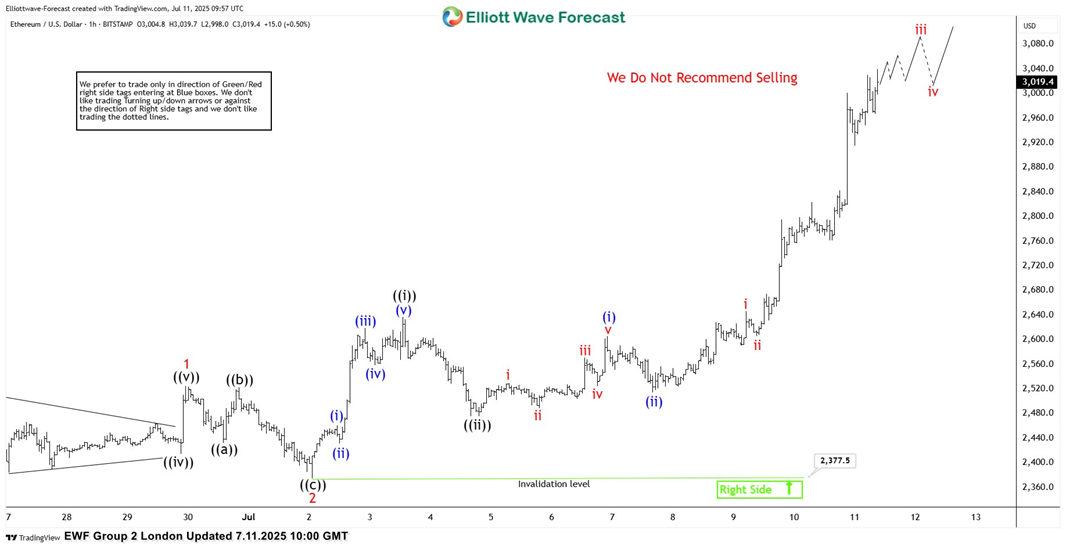
ETH/USD Elliott Wave 1  Hour  Chart 07.11.2025

The crypto held above the 2,377.5 low and continued to rally, as expected. The price made a break toward new highs. We do not recommend selling the crypto at this time and favor the long side. Ethereum is reaching our proposed target at  3,036.5–3,441.1 area and should ideally keep trading higher within that zone in upcoming days.

Reminder for members: Please keep in mind that the market is dynamic, and the presented view may have changed in the meantime. 
Author

Elliott Wave Forecast Team

Elliott Wave Forecast Team

ElliottWave-Forecast.com

More from Elliott Wave Forecast Team
Share:

Editor's Picks

Pi Network Price Forecast: Persistent selling pressure offsets Pi Ecosystem Summit

Pi Network shows a minor relief run on Thursday after losing 7% the previous day. On Day 2 of the Pi Ecosystem Summit, the launch of Pi DataLab and its AI-assisted SoloHost application was announced. Technically, PI is poised for a further downside move below $0.0500 as selling pressure remains firm despite oversold conditions.

Top Altcoins Price Forecast: Ripple, Cardano, and Solana capped and vulnerable to downfall

Top altcoins, Ripple, Cardano, and Solana, remain vulnerable to further losses as selling pressure persists. Nvidia CEO Jensen Huang resignation and inflation concerns continue to keep broader market conditions volatile. CoinMarketCap’s Fear and Greed Index sits at a four-month low of 11 on Thursday, suggesting intense risk-off sentiment in the market.

Ripple and Stellar outlook: Weakening market signals put XRP and XLM at risk

Ripple and Stellar extend their losses on Thursday, with both altcoins struggling to find support amid persistent selling pressure. In addition, weakening derivatives metrics and cautious on-chain signals suggest further downside risk for both altcoins. Ripple and Stellar derivatives data show a bearish bias.

Bitcoin, crypto market remain subdued as hawkish Fed minutes reinforce December rate hike
Bitcoin (BTC) and the crypto market remained subdued on Wednesday after the Federal Reserve's (Fed) October meeting minutes revealed growing support among policymakers for further interest rate hikes. The top crypto fell further below $63,000 after the announcement, while Ethereum (ETH) fell nearly 2% to $1,770, and altcoins traded largely lower.
Bitcoin: BTC drops below $68,000 as oversold signal fails to stop sellers
Bitcoin (BTC) extends its correction, falling more than 8% and hitting an intraday low of $67,568 on Friday. Despite oversold technical signals, selling pressure continues to intensify, with persistent Exchange Traded Funds (ETFs) outflows, leveraged liquidations and weakening risk appetite weighing on the Crypto King outlook.