Elliott Wave analysis: Ethereum recovered well from the 1620.15 level [Video]
![Elliott Wave analysis: Ethereum recovered well from the 1620.15 level [Video]](https://editorial.fxstreet.com/images/Markets/Currencies/Digital Currencies/Ethereum/ethereum_4.jpg)
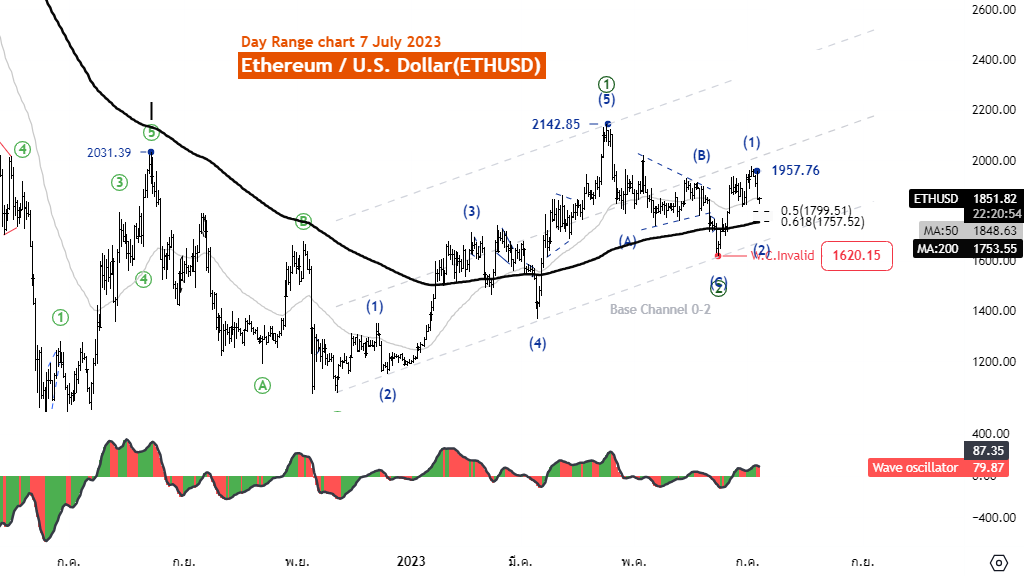
Ethereum Elliott Wave Analysis TradingLounge Daily Chart, 7 July 2023.
Ethereum/U.S.dollar(ETHUSD).
ETHUSD Elliott Wave Technical Analysis.
Function: Reactionary(Counter Trend).
Mode: Corrective.
Structure: Zigzag.
Position: Wave (C).
Direction Next higher Degrees: wave ((2)) of Motive.
Details: Wave ((2)) is likely to end at the level of 1620.15 A five-wave rise from this point will support this idea.
Wave Cancel invalid level: 1620.15.
Ethereum/U.S.dollar(ETHUSD)Trading Strategy: Ethereum recovered well from the 1620.15 level and was able to form a strong five-wave structure, giving Ethereum the opportunity to form a new uptrend. Still, the price is still in the correction of wave (2), so wait for the reversal of wave (2) to complete to join the trend again.
Ethereum/U.S.dollar(ETHUSD)Technical Indicators: The price is below the MA200 indicating a downtrend, Wave Oscillator are bullish momentum.
Ethereum daily chart
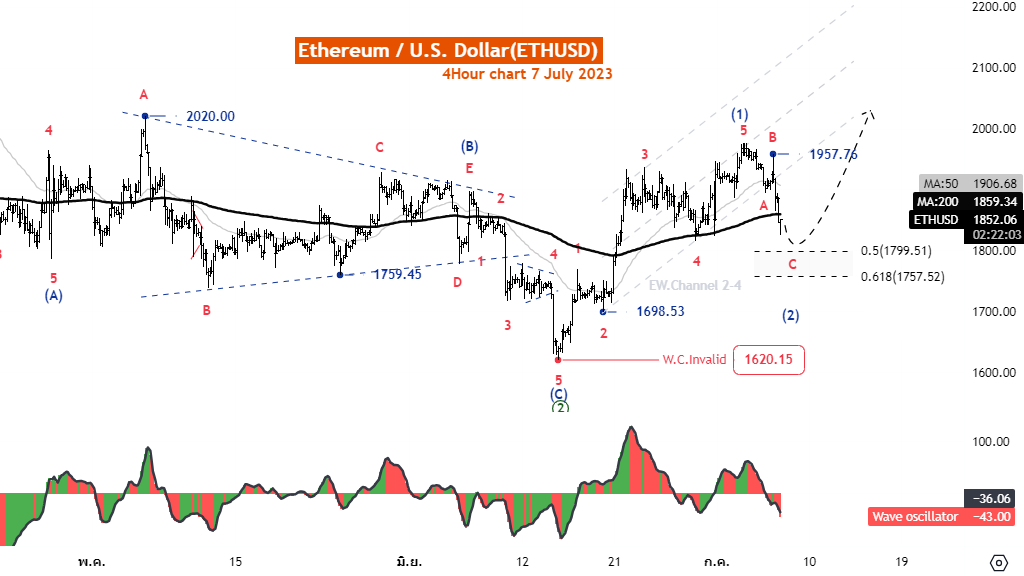
Elliott Wave Analysis TradingLounge 4H Chart, 7 July 2023,
Ethereum/U.S.dollar(ETHUSD)
ETHUSD Elliott Wave Technical Analysis
Function: Reactionary(Counter Trend)
Mode: Corrective
Structure: Zigzag
Position: Wave (C)
Direction Next higher Degrees: wave ((2)) of Motive
Details: Retracement of wave ((2)) usually .50 or .618 x Length wave ((1))
Wave Cancel invalid level: 1620.15
Ethereum/U.S.dollar(ETHUSD)Trading Strategy: Ethereum recovered well from the 1620.15 level and was able to form a strong five-wave structure, giving Ethereum the opportunity to form a new uptrend. Still, the price is still in the correction of wave (2), so wait for the reversal of wave (2) to complete to join the trend again.
Ethereum/U.S.dollar(ETHUSD)Technical Indicators: The price is above the MA200 indicating an uptrend, Wave Oscillator are bullish momentum
Author

Peter Mathers
TradingLounge
Peter Mathers started actively trading in 1982. He began his career at Hoei and Shoin, a Japanese futures trading company.


