|

Ethereum Elliott Wave technical analysis [Video]

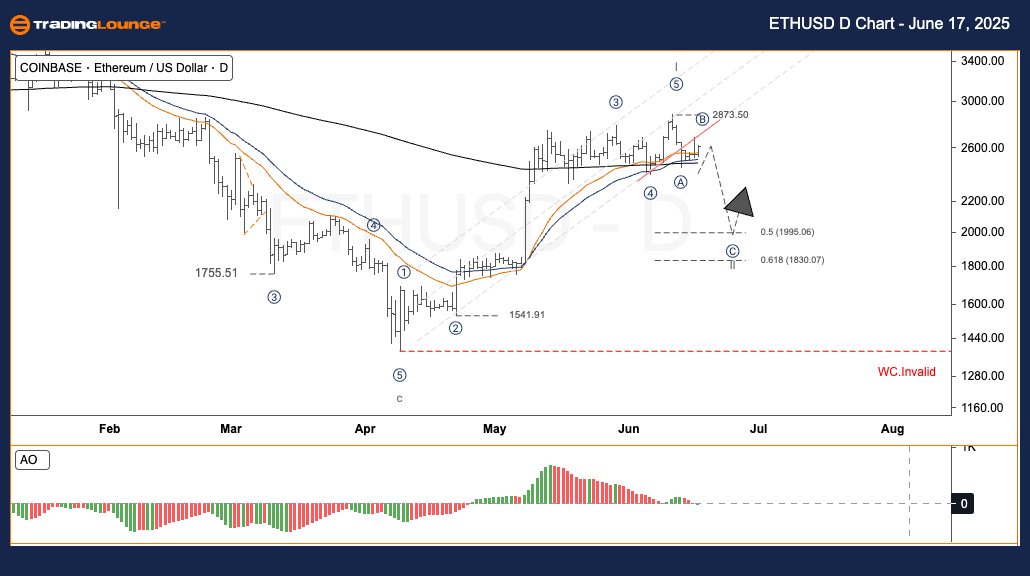
Daily chart – ETH/USD technical analysis

  • Function: Follow Trend.

  • Mode: Motive.

  • Structure: Impulse.

  • Current wave position: Wave 2.

  • Wave cancel invalid level: Pending.

Technical overview

Ethereum (ETH) surged above the $2,800 mark during Wave I, showing a solid bullish impulse. Following this, price action weakened, indicating a consolidation that fits into a Wave II bearish correction scenario. As per Elliott Wave principles, if prices remain above key Fibonacci support and bullish momentum returns, a powerful Wave III may follow—potentially the strongest in this cycle.

ETHUSD trading strategy

  • Short-term strategy (Swing Trade):

    • Entry zone: Wave II may offer accumulation opportunities. Look for bullish reversals from the $2,100 to $1,950 zone.

  • Risk management:

    • Invalidation level: $1,385.76 – Breaching this level would nullify the current wave count and necessitate a reassessment.
Chart

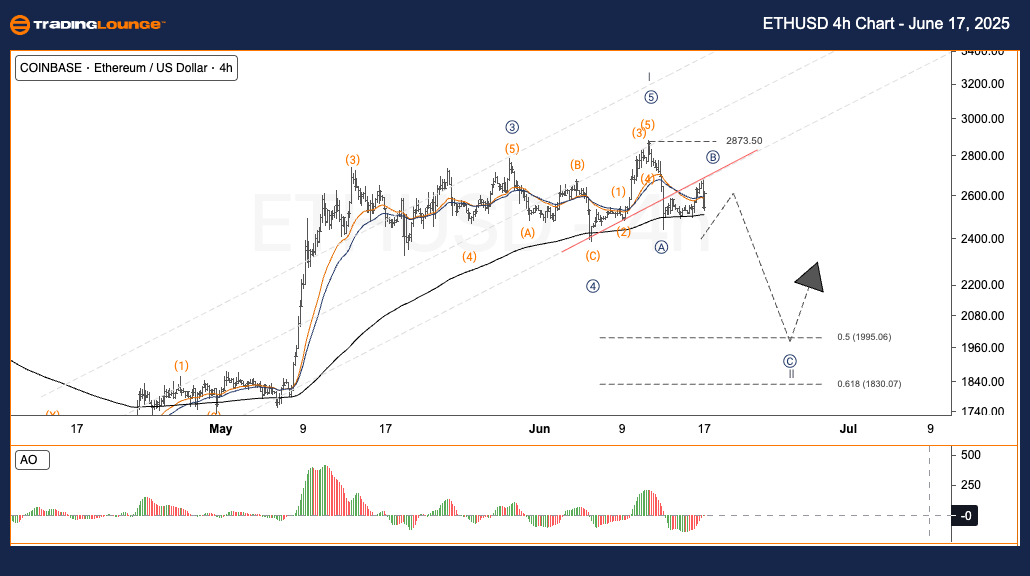
Four-hour chart – ETH/USD technical analysis

  • pFunction: Follow Trend.

  • Mode: Motive.

  • Structure: Impulse.

  • Current wave position: Wave 2.

  • Wave cancel invalid level: Pending.

Market summary

Similar to the Daily Chart, Ethereum’s H4 structure reaffirms the transition into a Wave II correction. A potential bullish Wave III could emerge if the price structure holds above the $1,950–$2,100 region. Traders should watch this zone for confirmation signals.

ETH

Ethereum Elliott Wave technical analysis [Video]

Author

Peter Mathers

Peter Mathers

TradingLounge

Peter Mathers started actively trading in 1982. He began his career at Hoei and Shoin, a Japanese futures trading company.

More from Peter Mathers
Share:

Editor's Picks

XRP holds $1.40 amid ETF inflows and stable derivatives market

Ripple trades under pressure, with immediate support at $1.40 holding at the time of writing on Tuesday. A recovery attempt from last week’s sell-off to $1.12 stalled at $1.54 on Friday, leading to limited price action between the current support and the resistance.

Crypto Today: Crypto market holds $2.4 trillion as bearish sentiment persists around Bitcoin, Ethereum, XRP 

The Crypto King, Bitcoin, is constrained below $70,000, with the price holding around $69,000. Altcoins, including Ethereum and Ripple, exhibit technical weakness but are holding above key support levels at $2,000 and $1.40, respectively.

Aster tests resistance as whale activity, perpetuals volume surge

Aster (ASTER) edges higher by over 7% at press time on Thursday, crossing above its 200-period Exponential Moving Average (EMA) on the 4-hour chart while testing a long-term resistance trendline on the daily.

Bitcoin slips below $69,000 as crypto market shows cautious stabilization

Bitcoin price is nearing the lower consolidation boundary, trading below $69,000 at the time of writing on Tuesday. A breakdown below this key level would suggest a correction toward $60,000. However, institutional and corporate demand support a short-term stabilization in BTC.

Bitcoin Price Annual Forecast: BTC holds long-term bullish structure heading into 2026

Bitcoin (BTC) is wrapping up 2025 as one of its most eventful years, defined by unprecedented institutional participation, major regulatory developments, and extreme price volatility.

Bitcoin: The worst may be behind us

Bitcoin (BTC) price recovers slightly, trading at $65,000 at the time of writing on Friday, after reaching a low of $60,000 during the early Asian trading session. The Crypto King remained under pressure so far this week, posting three consecutive weeks of losses exceeding 30%.